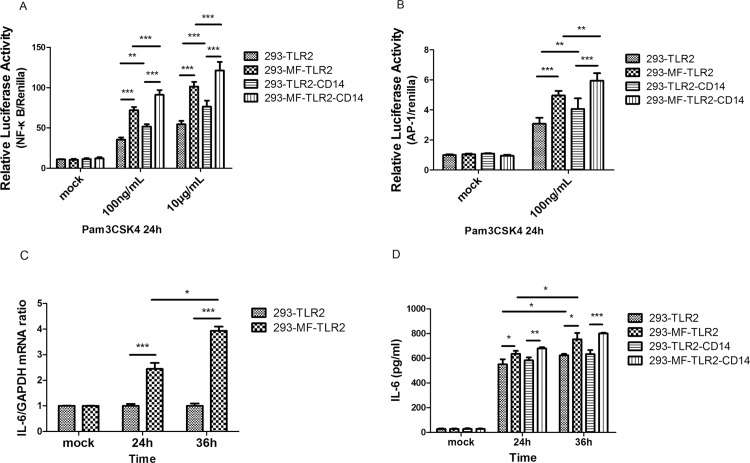
Fig 3. MFHAS1 activates NF-κB, AP-1, and IL-6 expression 24 h after stimulation with Pam3CSK4 through TLR2.
(A, B) HEK 293 cells and 293-MFHAS1 cells were transiently transfected with 100 ng TLR2 or 100 ng TLR2/50 ng CD14 expression plasmids, an100 ng NF-κB luciferase reporter plasmid (A) or 20 ng AP-1 luciferase reporter plasmid (B) and 10 ng renilla plasmid. 24 h post-transfected cells were exposed to mock treatment, Pam3CSK4 100 ng/mL or 10μg/mL. At 24 h posttreatment, fold increase in luciferase activity was measured for NF-κB or AP-1 activation using dual luciferase kits. The relative luciferase activity was calculated from the ratio of NF-κB/AP-1 (firefly) activity to renilla activity. (C, D) HEK 293 cells and 293-MFHAS1 cells were transiently transfected with 100 ng TLR2 or 100 ng TLR2/50 ng CD14 expression plasmids, and 24 h post-transfected cells were untreated or exposed to Pam3CSK4 100 ng/mL. After 24 h and 36 h posttreatment, induction of IL-6 expression was assayed by quantitative RT-PCR and normalized to β-actin (C). Cell supernatant was collected and the amounts of IL-6 were determined by ELISA (D). Values are the means ± SD from at least three independent experiments. *p < 0.05, **p < 0.01, or ***p < 0.001.

