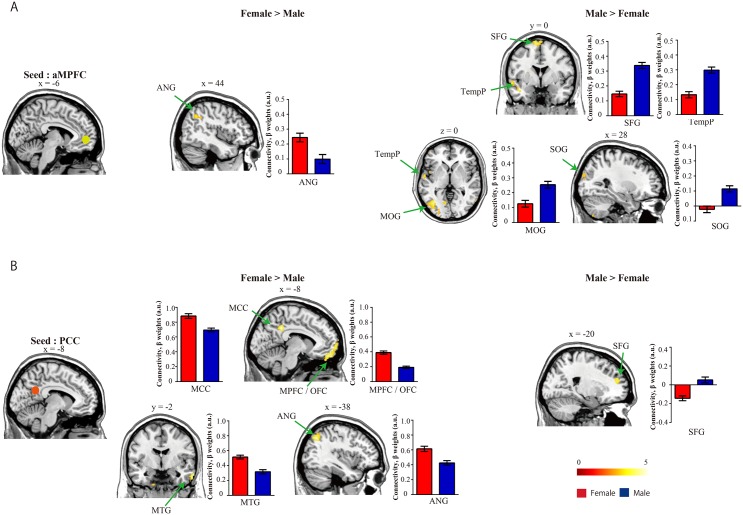
Fig 3. Seed-based analysis functional connectivity results.
(A) Comparison of aMPFC seed ROI functional connectivity between groups. Females showed stronger connectivity to the ANG, but males showed stronger connectivity to the SFG, TempP, MOG, and SOG. (B) Comparison of PCC seed ROI functional connectivity. Females showed stronger connectivity to the MOG, MPFC/OFC, MTG, and ANG, but males exhibited stronger connectivity in the SFG. The maps depict the statistical threshold at p < 0.001 uncorrected for height and a cluster at p < 0.05 uncorrected for extend. The bar graph indicates the mean and standard error of beta weights in each group. The red and blue bars indicate females and males, respectively. Color bars denote the t-statistic range. aMPFC, anterior prefrontal cortex; ANG, angular gyrus; MOG, middle occipital gyrus; MPFC, medial prefrontal cortex; MTG, middle temporal gyrus; OFC, orbital frontal cortex. PCC, posterior cingulate cortex; SFG, superior frontal gyrus; TempP, temporal pole.

