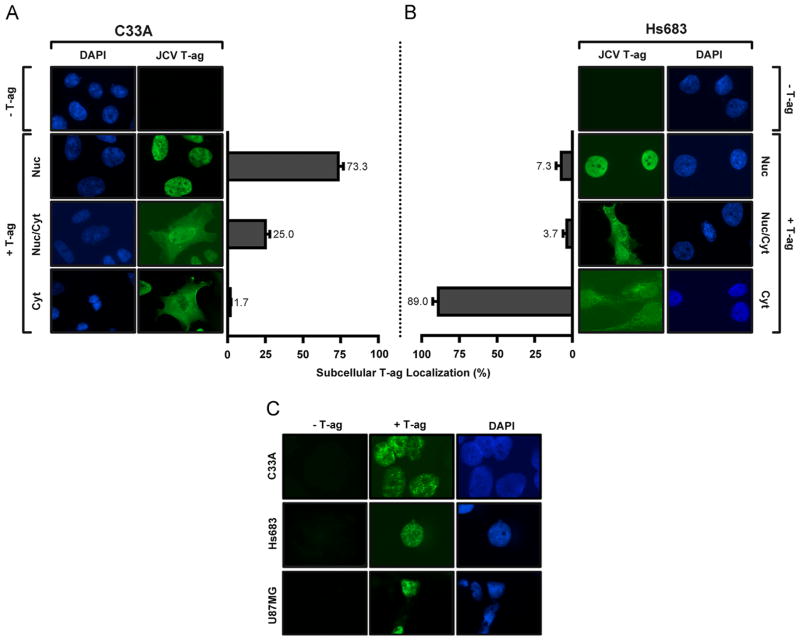
Fig. 3.
Determination, via immunofluorescence, of the subcellular localization of JCV T-ag in C33A cells and two glial cell lines (Hs 683 and U87). A. Representative images of JCV T-ag (green) within C33A cells obtained using the previously described “standard” technique (Boichuk et al., 2010). The cell nuclei were stained with DAPI. The histograms present the percentage distribution of T-ag in the nuclei, both nuclei and cytoplasm or just cytoplasm of the two different cell types. B. Representative images of JCV T-ag within Hs 683 cells using the identical technique; the cell nuclei are indicated. (In both instances, the percentages were established after counting ~ 300 cells). C. Demonstration, using a modification of the immunofluorescence technique that involves pre-extraction of T-ag, of the “punctate distribution” of JCV T-ag in the nuclei of C33A, Hs 683 and U87 cells.

