
Fig 3. Total surgical time and LAD ligation time.
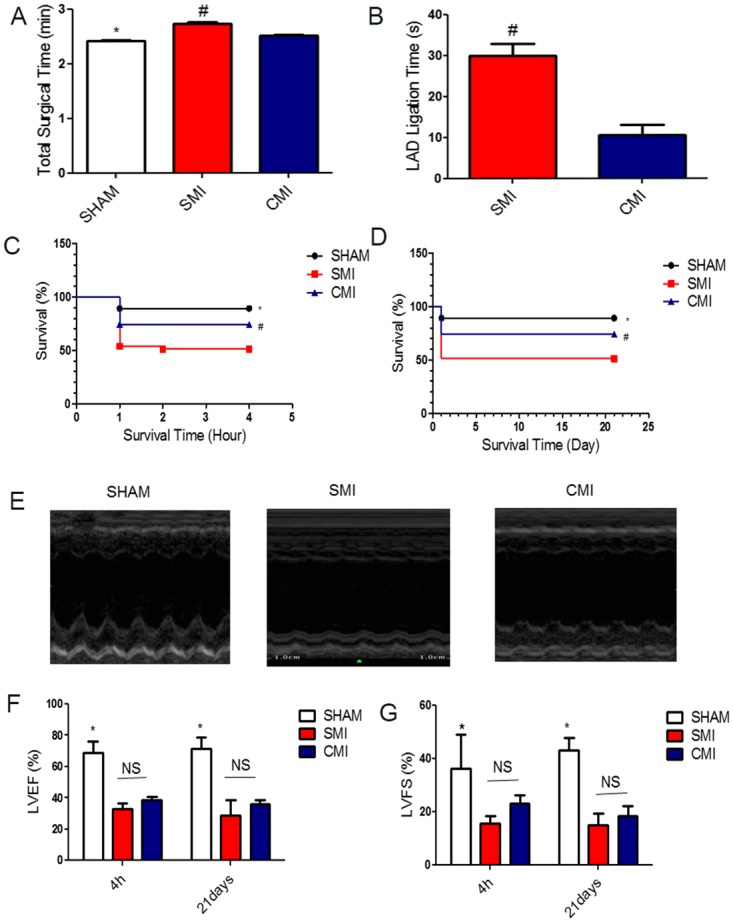
(A): Total surgical time for the AMI model in SHAM (black bar), SMI (blue bar) and CMI (red bar) groups (n = 6); (B): Time required for left anterior descending artery (LAD) ligation in SMI (blue bar) and CMI (red bar) groups (n = 6). Survival rates in the two MI models. (C): Mice were subjected to SHAM or myocardial infarction (MI) surgery with either suture method or clip method and 4 hour perisurgery survival rate was recorded. (D): Long-term (21 day) survival rate. Cardiac functions in the two MI models measured by echocardiography. (E): Representative echocardiograph showing wall motion in SHAM, SMI and CMI groups at 21 day. (F & G): Left ventricular ejection fraction (LVEF) and left ventricular fraction shortening (LVFS) were measured by echocardiography at baseline (4 h post-MI) and 21 days afterward in SHAM, SMI and CMI groups (n = 6 animals per group). * indicates P<0.05 when compared to SHAM group; # indicates P<0.05 when compared to SMI group; NS indicates P>0.05 when compared to each other.