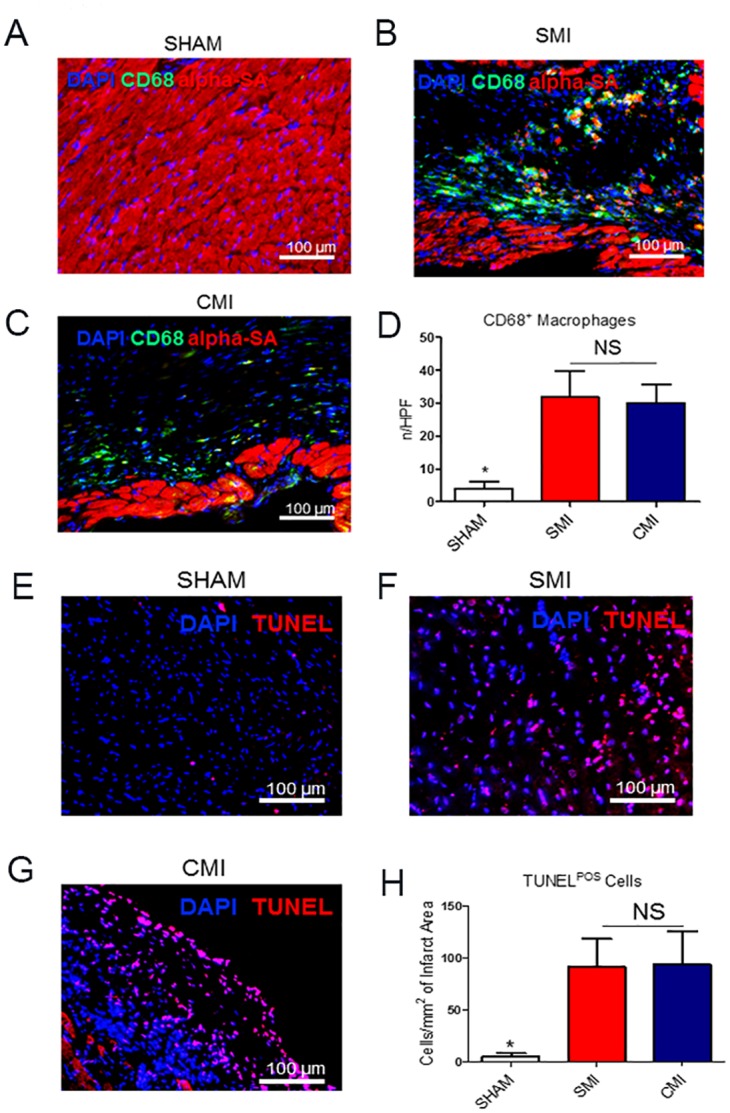
Fig 4. Inflammatory response in the two MI models.

(A-C): Representative fluorescent micrographs showing the presence of CD68+ macrophages (green) in the hearts of SHAM (A), SMI (B), and CMI (C) groups. (D): Quantitation of CD68+ macrophages in each group at Day 21 (n = 3). Cell apoptosis in the two MI models. (E-G): Representative fluorescent micrographs showing the presence of TUNEL+ apoptotic cells (red) in the hearts of SHAM (E), SMI (F), and CMI (G) groups. (H): Quantitation of TUNEL+ cells (red) in each group at Day 21 (n = 3). Scale bars = 100 um. * indicates P<0.05 when compared to SHAM group; NS indicates P>0.05 when compared to each other.
