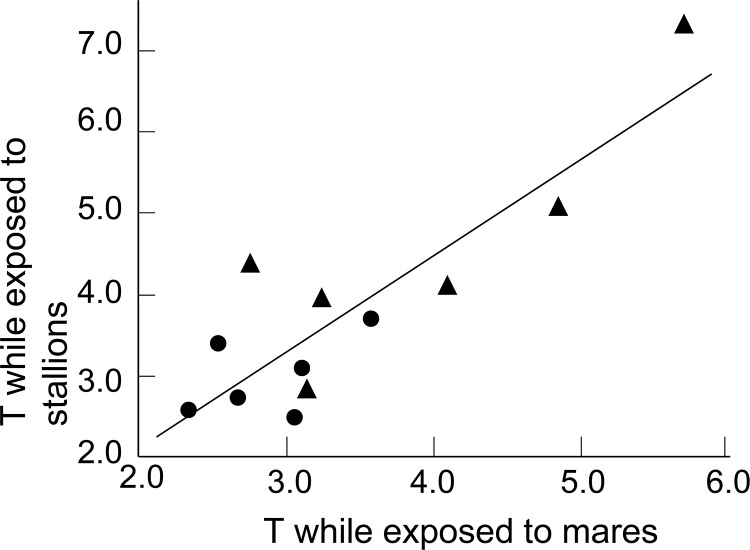
Fig 2. Testosterone levels.
Correlation between average peripheral plasma testosterone levels (“T”; in nmol/L) while exposed to mares or to stallions (Kendalls’ tau = 0.58, p = 0.009). Stallions were either first exposed to stallions and then to mares (triangles) or vice versa (circles). The line gives the regression.

