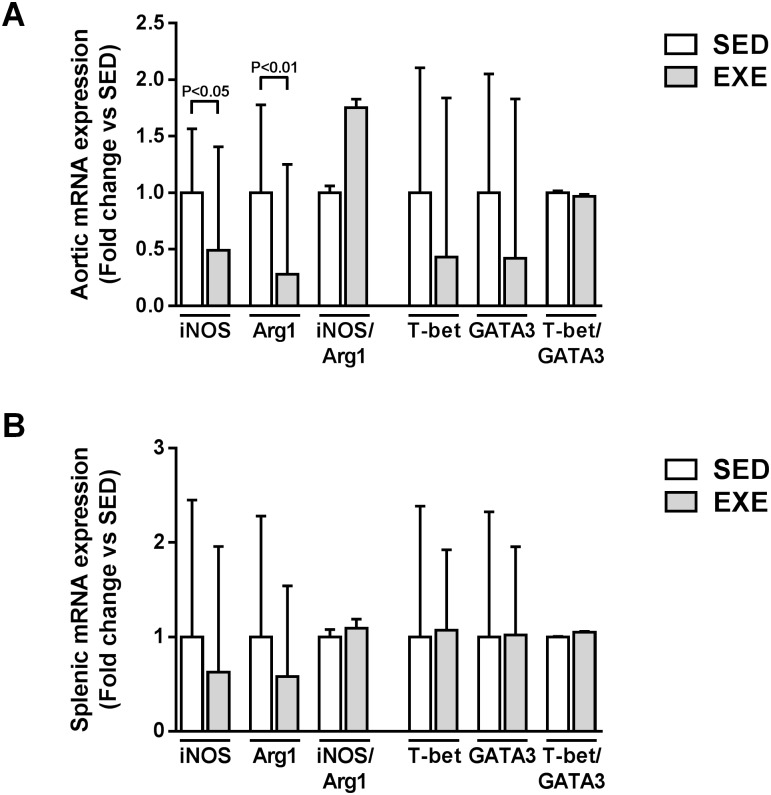
Fig 5. Comparison of local and systemic CD4+ T helper cells and macrophage polarization markers expression among 8-week 2K1C ApoE-/- SED and EXE mice.
Aortic (A) and splenic (B) mRNA expression of pro-inflammatory M1 macrophages (iNOS) and Th1 cells (T-bet) and anti-inflammatory M2 macrophages (Arg1) and Th2 cells (GATA3) measured by quantitative real-time PCR. Fold change ratios of iNOS to Arg1 (M1/M2 balance marker) and of T-bet to GATA3 (Th1/Th2 cells balance marker) were calculated. N = 6 mice in SED group; N = 7 mice in EXE group. Data are expressed as fold change ± SD compared to SED (set at 1) after normalization to the 36B4 housekeeping gene.

