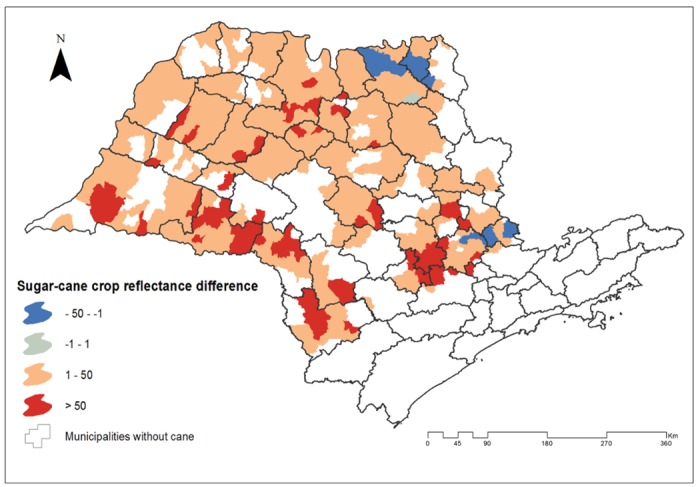
Fig 3. Sugarcane crops pixel abundance difference between the 2007–2012 and 2000–2006 periods.

Negative (blue) values indicate that the pixel abundance was higher at 2000–2006 period and positive (red) values indicate that the pixel abundance value was higher at the 2007–2012 period.
