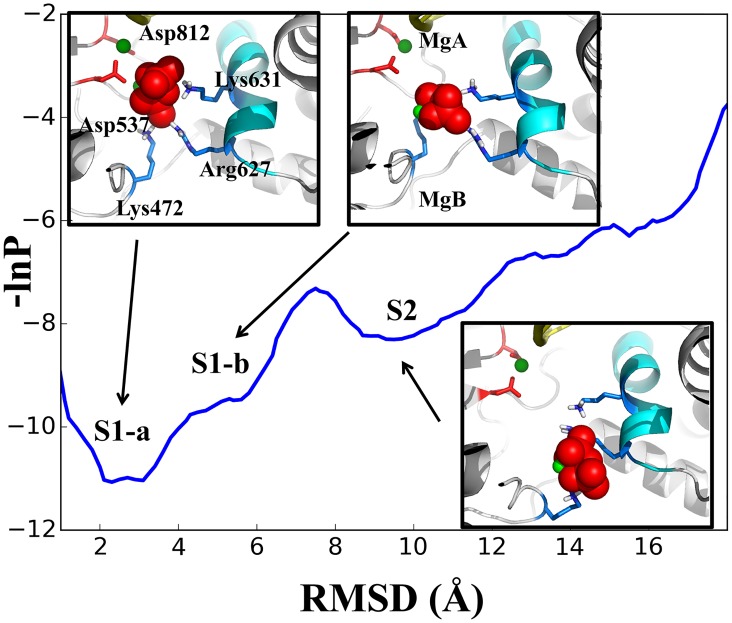
Fig 2. The population density profile for conformations sampled along the simulated PPi release pathways.
The profile is shown on a potential-like surface along the PPi RMSD coordinate. Three population states are identified: S1a, S1b, and S2, with representative snapshots shown for each state. The color scheme in the structure is the same as that in Fig 1. The convergence tests of the profile is provided in SI S2 Fig.

