. 2015 Nov 23;10(11):e0140936. doi: 10.1371/journal.pone.0140936

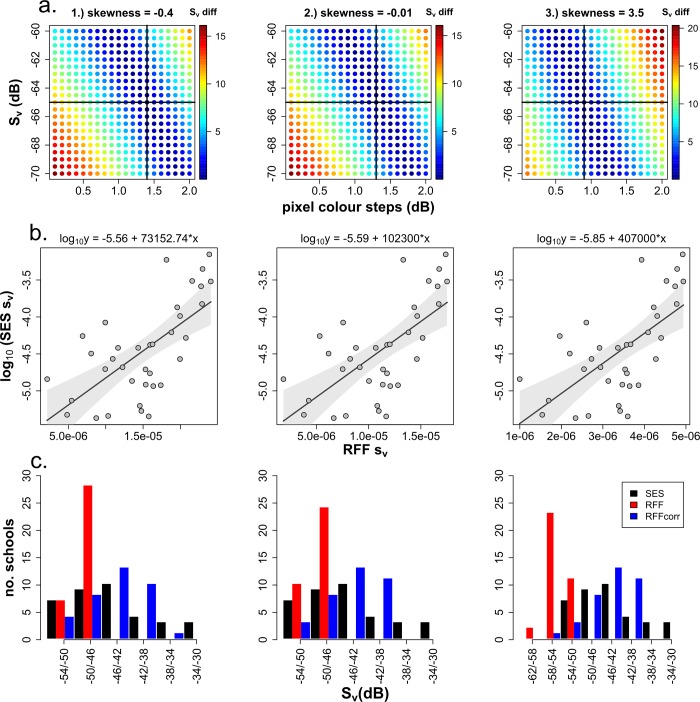
Fig 5. Plots for three scenarios, 1–3, representing three schools selected from the recreational fish-finder (RFF) outputs with different pixel skewness values: a) 2D scatter plots showing the influence of different combinations of mean volume backscattering strength (Sv) starting values and colour step values on the difference in Sv values (Sv diff) between the RFF and the scientific echosounder (SES) outputs (colour scale bar—low values indicate optimal estimates), cross-hatch denotes optimal colour step values at starting values of -65 dB; b) least-squares regressions between volume backscattering coefficients (sv¯) of the SES (transformed) and RFF outputs of the 36 matched schools using starting and colour step values for the RFF outputs as determined by the 2D scatter plot analyses, coefficients are given at the top of each plot and shaded areas denote the 95% confidence intervals; c) histograms showing the frequency of schools in 4 dB Sv bins for the SES-derived schools, the RFF-derived schools before application of a correction factor as predicted by the linear regression models (b), and the RFF-derived schools with this correction factor applied (RFF corr).

Fig 5