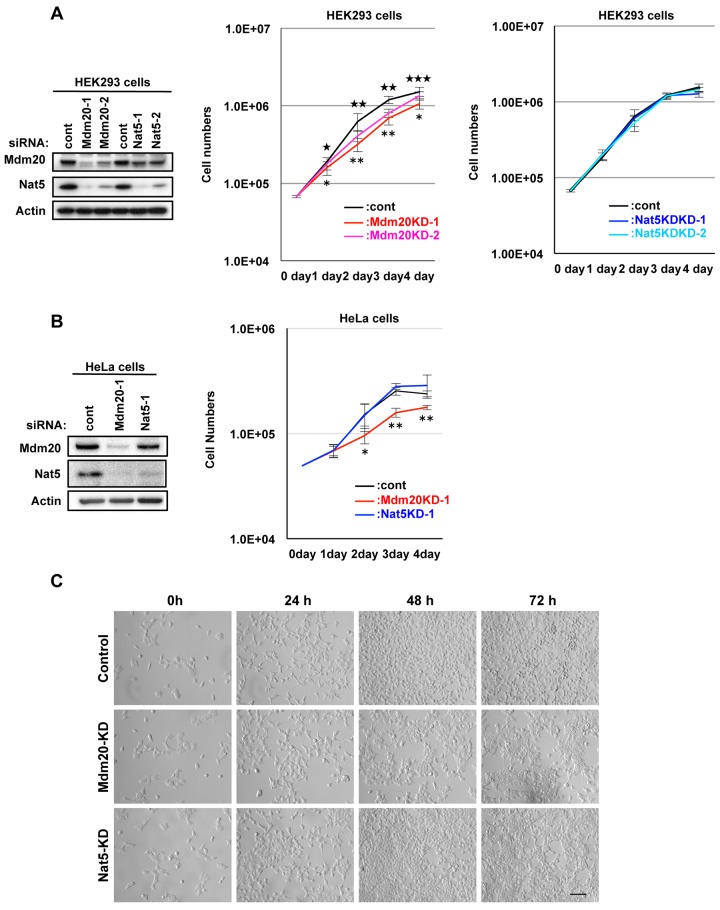
Fig 1. Mdm20 deficiency suppresses cell growth.
A. Growth curve for Mdm20-KD and Nat5-KD HEK293 cells. The left panel shows the effectiveness of the siRNAs (control, Mdm20, and Nat5) 72 h post-transfection. After the transfection of cells with control, Mdm20, and Nat5 siRNA oligonucleotides, the number of cells was counted at the indicated time points and compared with the number of control cells. The data represent the mean ± the S.D. (n = 5). ★P<0.05, ★★P<0.005 and ★★★P<0.0005 indicate statistical significance between control and Mdm20-KD-1 cells. *P<0.005 and **P<0.0005 indicate statistical significance between control and Mdm20-KD-2 cells. B. Mdm20- and Nat5-KD HeLa cells displayed suppressed cell growth. Left panel: Western blot showing the effectiveness of the siRNAs (control, Mdm20 and Nat5). Right panel: Evaluation of cell growth using a similar method to A. The data represent the mean ± the S.D. (n = 5). *P<0.02 and **P<0.0001 indicate statistical significance between control and Mdm20-KD cells. C. Representative images of HEK293 cell growth at 0, 24, 48 and 72 h after siRNA transfection (Scale bar: 100 μm.).

