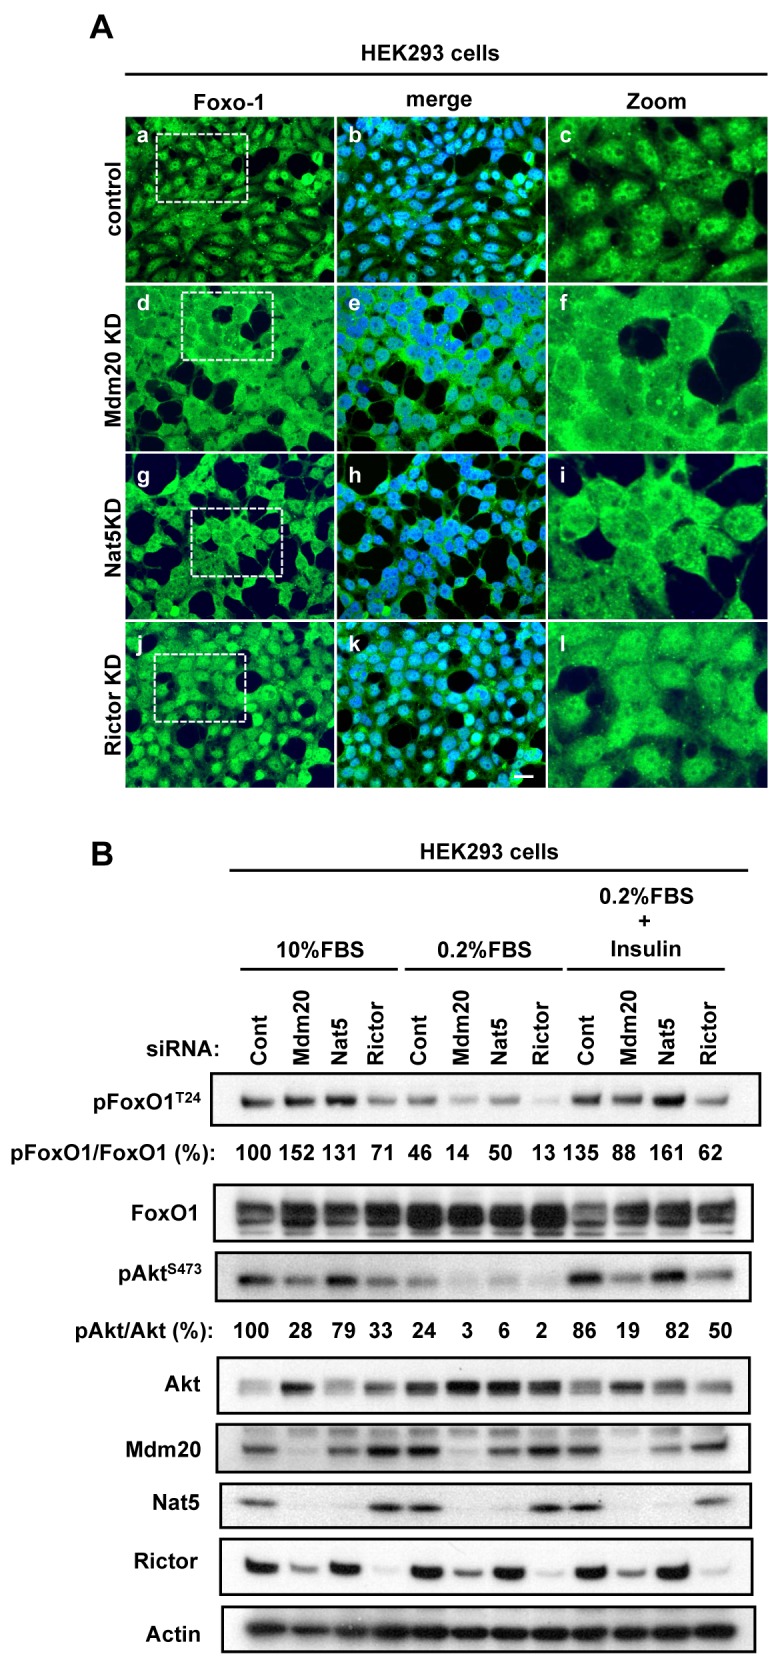
Fig 7. Effect of reduced levels of Mdm20 on FoxO1 localization and phosphorylation in Mdm20-KD cells.

A. Immunohistochemistry against FoxO1 in Mdm20-, Nat5- and Rictor-KD HEK293 cells. Panels a, d, g and j are immunostained with anti-FoxO1 antibody; these images are merged with DAPI (blue) staining in panels b, e, h, and k. Low magnification (a, d, g, and j) and partial zoom up views (c, f, i, and l) of the indicated area (dotted line squares) are shown. (Scale bar: 20 μm.) B. Western blots of pFoxO1 to evaluate its induction in response to insulin stimulation. Control, Mdm20-KD, Nat5-KD, and Rictor-KD HEK293 cells were serum starved (0.2% FBS) for 20 h, and were then treated with insulin (100 nM) for 30 min. Note that the pAkt bands are less intense in extracts of serum starved cells and enhanced in the extracts of insulin stimulation after serum starvation. Actin was used as a loading control. The amounts of pFoxO1 T24 relative to total FoxO1 protein and the amounts of pAktS473 relative to total Akt protein were calculated relative to those in the cell extracts from control siRNA-transfected cells.
