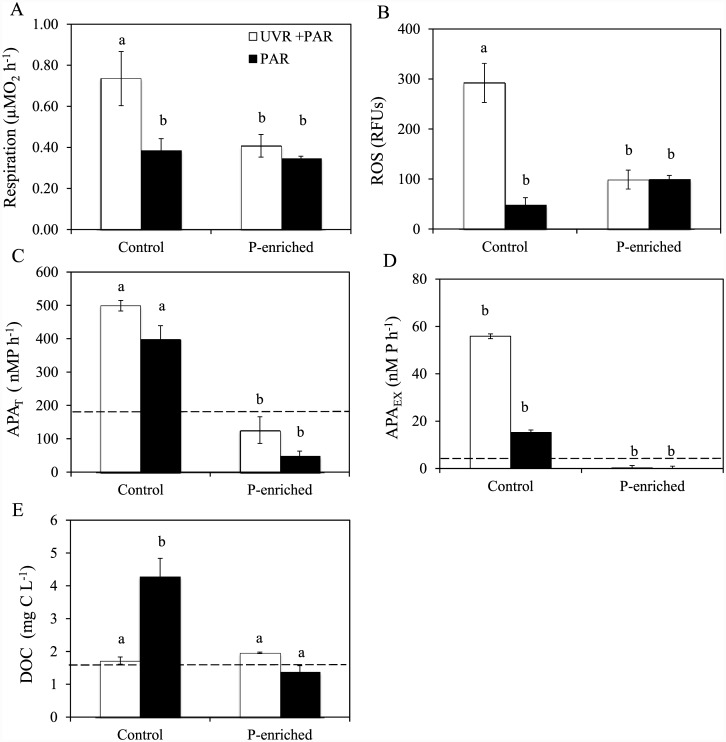
Fig 2. Response of metabolic, enzymatic variables and dissolved organic carbon to experimental conditions.
(A) Respiration rates (R, in μMO2 h-1); (B) Reactive oxygen species (ROS, in RFUs); (C) total alkaline phosphatase (APAT in nMP h-1); (D) Dissolved alkaline phosphatase (APAEX in nMP h-1); (E) Dissolved organic carbon (DOC in mgC L-1) under photosynthetically active radiation (PAR), and full sunlight (PAR+UVR) in nutrient-enriched (P-enriched) and non-enriched (control) treatments. Horizontal dashed lines indicate value for initial day. Data are expressed as mean values ± sd (n = 3). Significant differences among treatments are denoted by lower-case letters.

