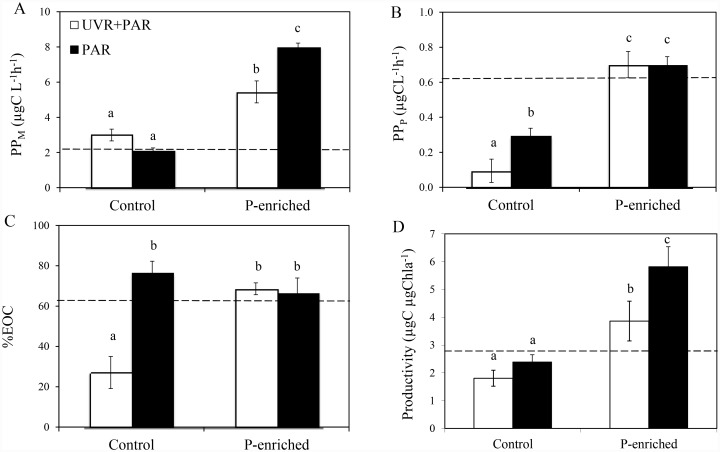
Fig 5. Primary production in different size fractions, excreted organic carbon (%) and productivity under experimental conditions.
(A) Microplanktonic primary production (PPM,in μgC L-1 h-1); (B) Picoplanktonic primary production (PPP, in μgC L-1 h-1); (C) Excreted organic carbon (% EOC); (D) Productivity (μgC μgChl a -1) under photosynthetically active radiation (PAR) and full sunlight (PAR+ UVR) in nutrient-enriched (P-enriched) and non-enriched (control) treatments. Horizontal dashed lines indicate value for the initial day. Data are expressed as mean values ± sd (n = 3). Significant differences among treatments are denoted by lower-case letters.

