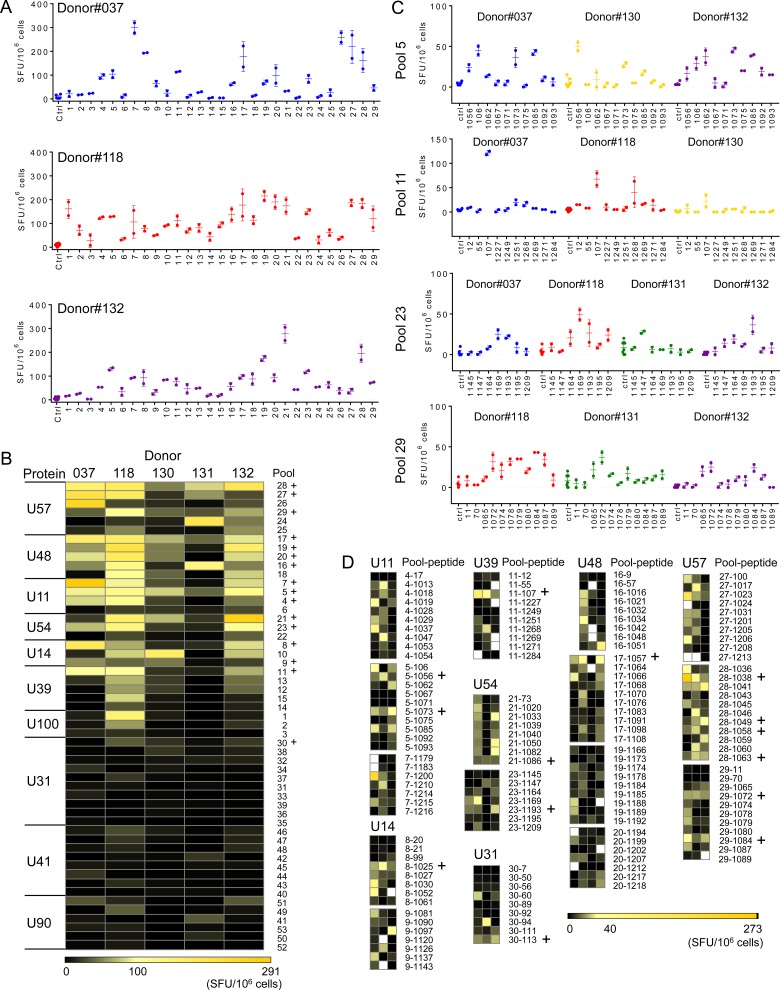
Fig 3. Mapping of the CD4 T cell responses in PBMCs to HHV-6B proteins.
A. IFN-γ ELISpot responses (SFU/106 cells) by donors #037, 118 and 132 to pools 1–29. Error bars represent the standard deviation of the replicates. B. Heat maps summarizing the response of all donors (n = 5) to all pools tested (53). Positive responses were assessed by DFR2x and ER analyses (see Methods). Pools for which positive responses were observed by DFR2x in at least 4 donors were selected for further analysis and are indicated by (+). C. IFN-γ ELISpot responses by different donors to individual peptides in pools 5, 11, 23 and 29. D. Heat-maps summarizing the IFN-γ responses to individual peptides present in the pools selected in B. Positive responses to individual peptides were assessed by ER and DFR2x analyses. Fourteen peptides that induced responses in multiple donors were selected for further validation, and are indicated by (+).

