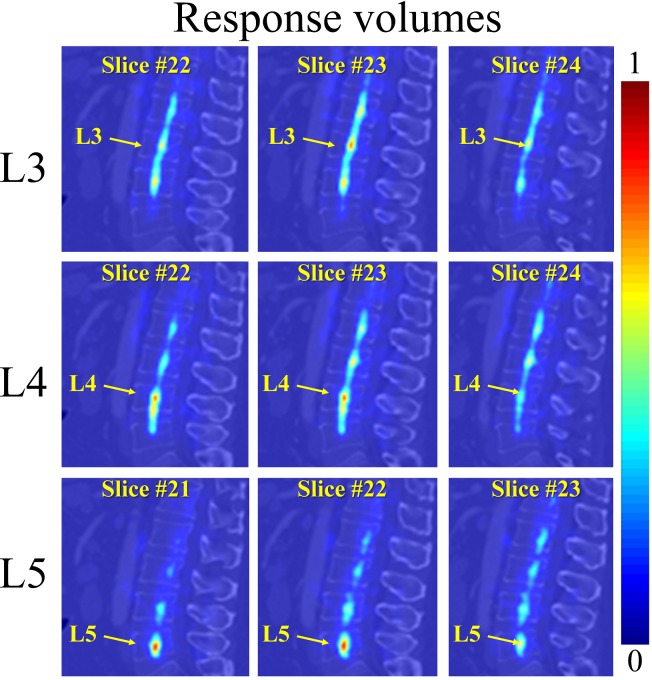
Fig 4. Initial estimation of the VB centers on one test CT image.
The estimation is done in a coarse resolution. The response volume of L3, L4, and L5 are visualized in each row, with 3 randomly selected 2D sagittal slices. The diffused probability distribution is observed in the response volumes due to the repetitive pattern of the VBs.

