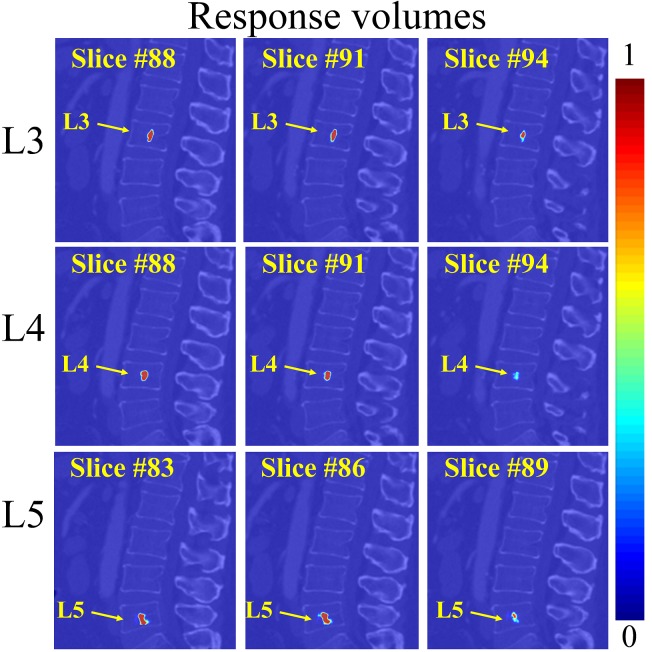
Fig 5. The fine-tuning step for localization of the estimated VB centers on the same test CT image used in Fig 4.
The response volume of L3, L4, and L5 are visualized in each row, with 3 randomly selected 2D sagittal slices. The fine-tuning is performed only in a reduced local region around the initial guess obtained from the first step. Thus, the associated probabilities in the response volume are concentrated to a small region.

