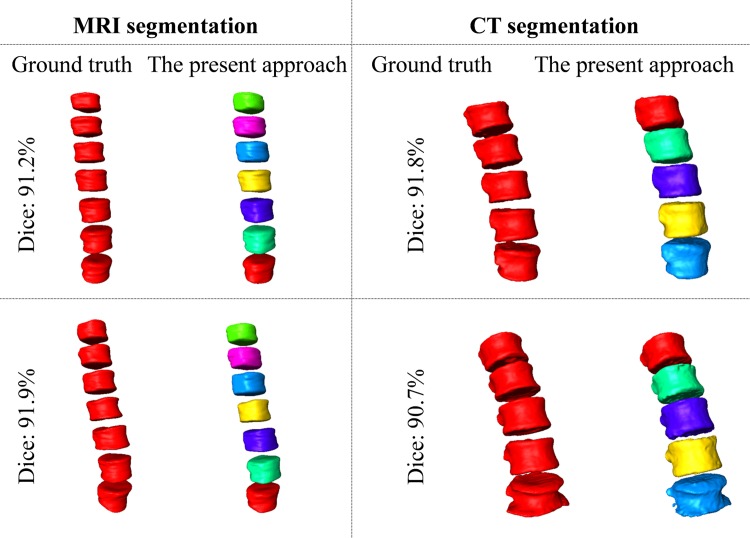
Fig 8. Segmentation results visualized with 3D surface models.
Images on the left side show the segmentation results on 2 3D MR test images and images on the right side present the segmentation results on 2 3D CT images. It is worth to note that the second CT data (bottom right image) shows osteophytes in some of the VBs but our method successfully identified and segmented all the 5 VB regions in this CT data with a Dice of 90.7%.

