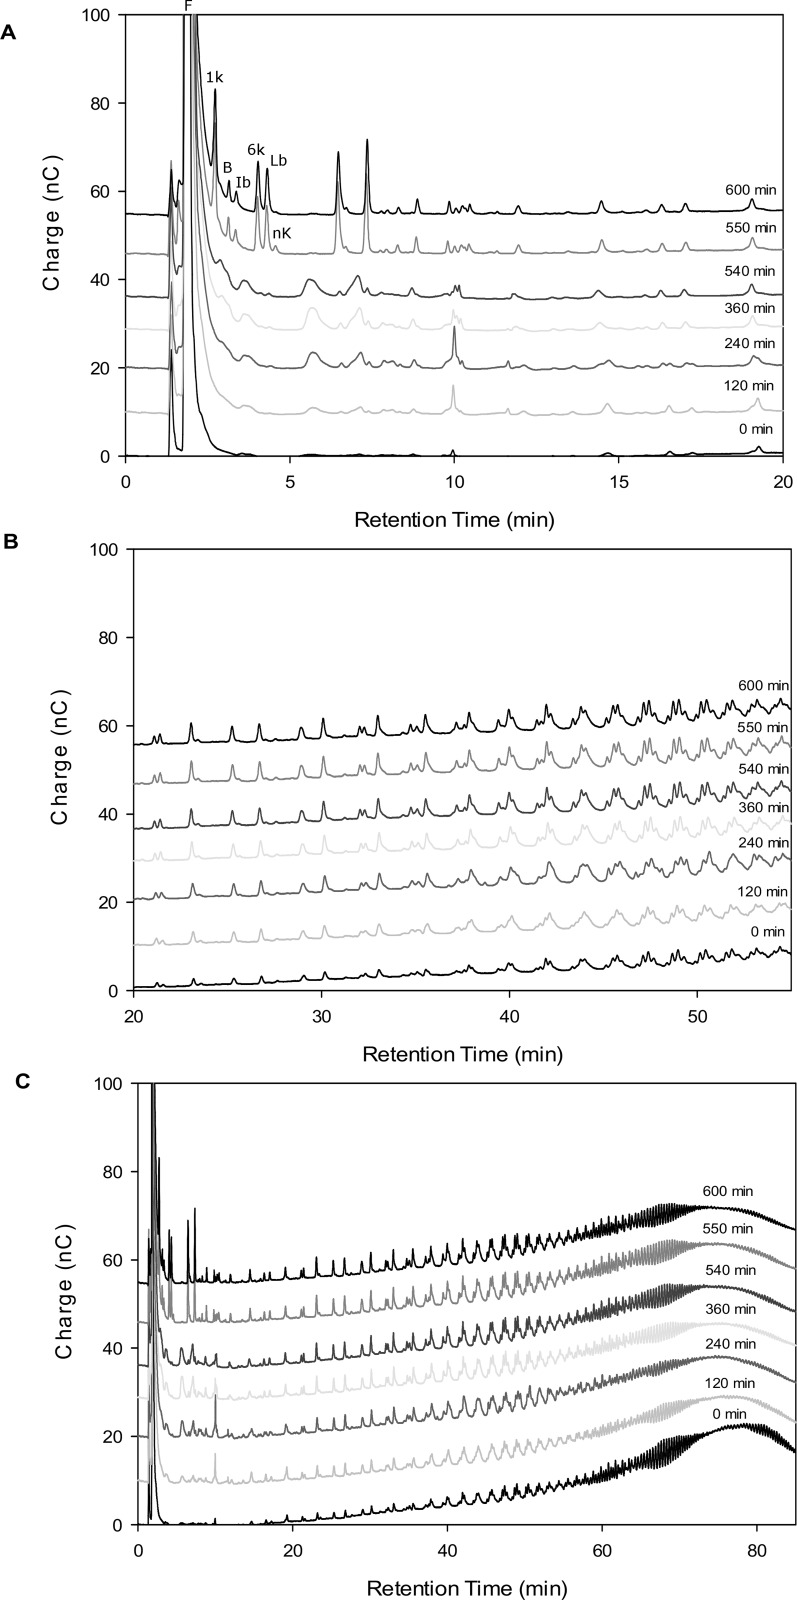
Fig 6. Evolution of low molecular weight levan distribution during hydrolysis by SacB (500 nM) as determined by HPAEC-PAD.
Samples correspond to reactions also described by Figs 3, 4 and 5. The chromatograms are shown according to levans molecular weights:A) Mono-, di- and fructo-oligosaccharides with elution times of 1.6–20 min, B) intermediate size levans with elution times of 20–50 min, C) Chromatogram showing all reaction products obtained from levan. Fructose (F), blastose (B), 1-kestose (1k), 6-kestose (6k), levanobiose (Lb), inulobiose (Ib) and neokestose (nk).

