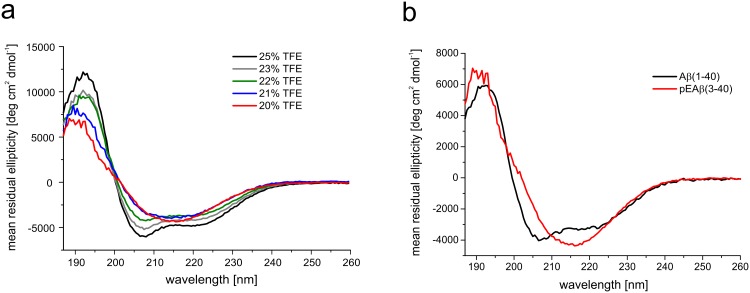
Fig 1. Far-UV CD spectra of pEAβ(3–40) and Aβ(1–40).
Peptides were dissolved in buffer (20–25% TFE in 50 mM potassium phosphate, pH 2.8). CD spectra were recorded at 20°C from 260 to 187 nm, accumulated 10 times and background corrected. (a) CD spectra of 25 μM pEAβ(3–40) in 25%, 23%, 22%, 21% and 20% TFE showed a shift from α-helical structure towards β-sheets with decreasing TFE concentrations. (b) The CD spectrum of 25 μM Aβ(1–40) indicated α-helices in 20% TFE while the spectrum of 25 μM pEAβ(3–40) in 20% TFE showed mainly β-sheet rich structures.

