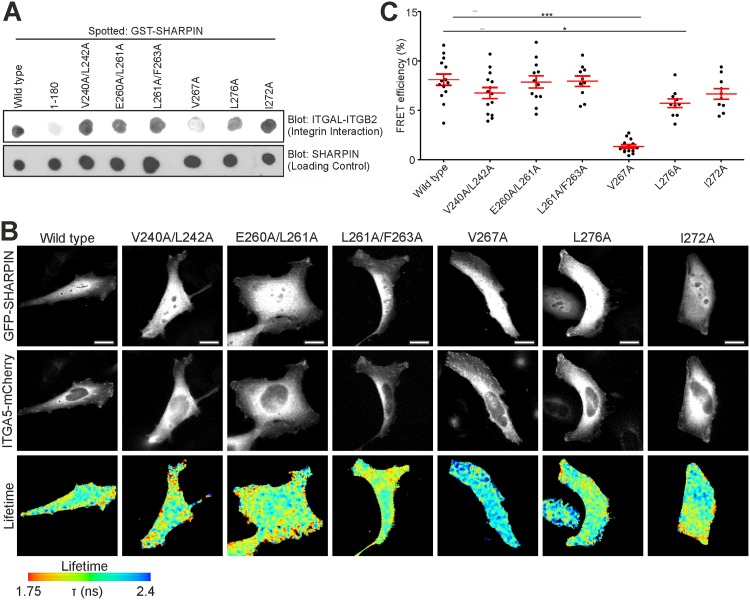
Fig 3. Fine mapping of the integrin binding site in SHARPIN.
(A) Interaction of different GST-SHARPIN (WT and all point mutants) with full-length ITGAL-ITGB2 was determined using Far-Western assays. GST-SHARPIN1-180 was used as negative control. (B) HEK293 cancer cells, overexpressing WT or mutant GFP-SHARPIN in combination with ITGA5–mCherry, subjected to FRET analysis by FLIM. Fluorescence lifetimes, mapping spatial FRET in cells, are depicted using a pseudo-color scale (blue, normal lifetime; red, FRET (reduced lifetime)). Scale bars: 10 μm. (C) Quantification of FRET efficiency for all mutants (n ≥ 12 cells). All numerical data are mean ± s.e.m. ***: p<0.001, *: p<0,05.

