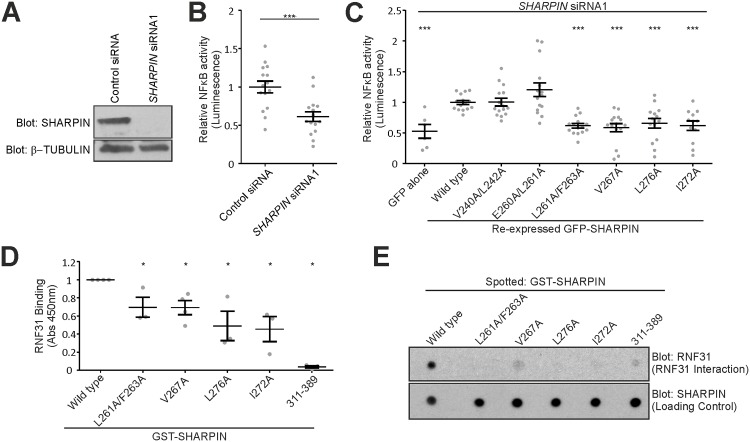
Fig 5. Fine mapping of the RNF31 binding site in SHARPIN.
(A) Western blot analysis of SHARPIN and β-tubulin levels in control- or SHARPIN-silenced PC3 cells. (B) TNF-induced NF-κB promoter activity of SHARPIN- or control-silenced PC3 cells was measured using a luciferase reporter assay. (n = 3 with 5 replicates each). (C) TNF-induced NF-κB promoter activity of SHARPIN-silenced PC3 cells, expressing GFP alone, WT or mutant GFP-SHARPIN (n = 6–15 measurements from 2–3 experiments). (D,E) Interaction between RNF31 and WT or mutant GST-SHARPIN was determined using an ELISA-based binding assay (n = 3) (D) or Far-Western analysis (E). All numerical data are mean ± s.e.m. ***: p<0.001, **: p<0.01, *: p<0.05.

