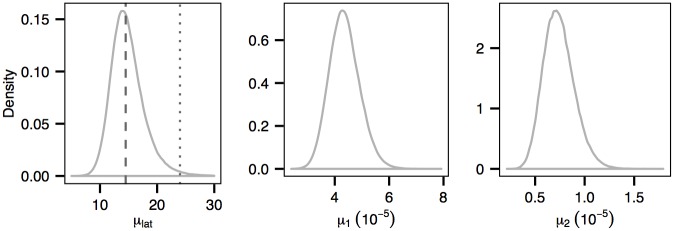
Fig 10. Posterior distributions of the mean latent period, denoted as μ lat, and of the transition rate μ 1 and transversion rate μ 2.
The grey dashed line and the dotted line indicate the median value of μ lat obtained from our analysis and from [20] respectively.

