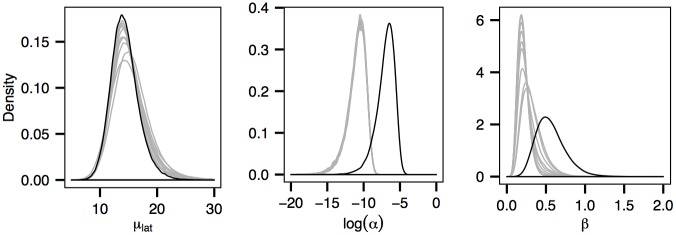
Fig 11. Posterior distributions of the mean latent period μ lat, the primary transmission rate α and the secondary transmission rate β obtained from fitting the model to 10 independently simulated datasets (grey curves) obtained by adding 300 randomly assigned susceptible premises.
The posteriors corresponding to the case ignoring susceptibles are coloured in black. The values of primary transmission rate α are represented on the logarithmic scale for ease of comparison.

