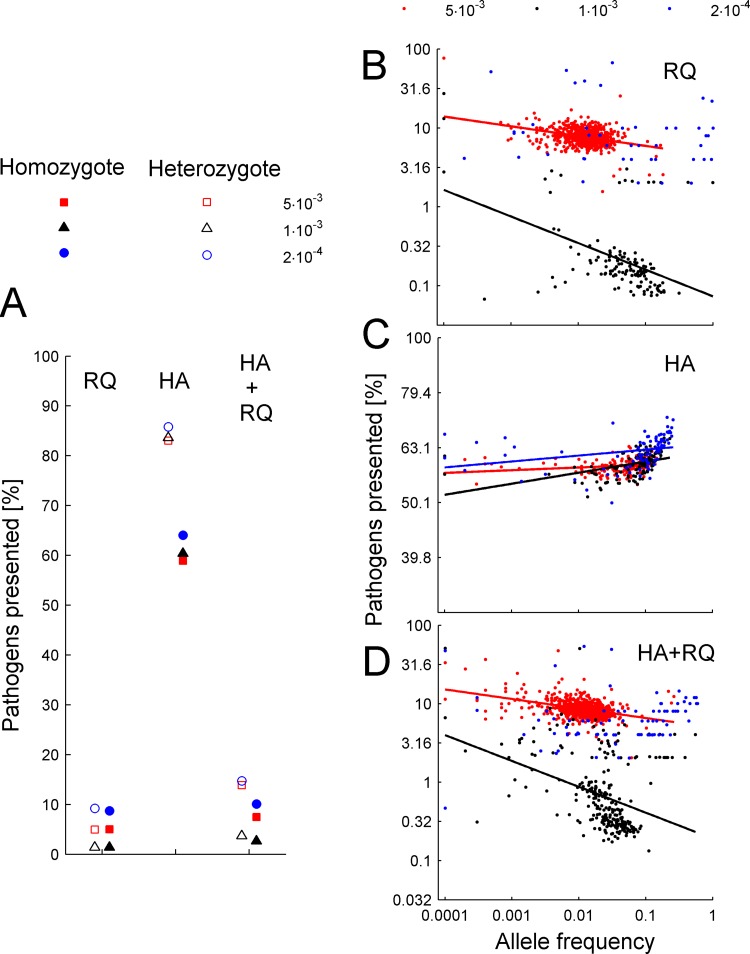
Fig 1. Patterns of frequency dependence and heterozygote advantage that emerged from the model.
(A) Comparison of pathogen recognition abilities between heterozygotes and homozygotes, depicted as averages across the last 6000 generations from 10 independent runs. Mutation rates for (A-D) are given in the legends; host population size N = 5000 individuals. (B-D) Relationship between the expected proportion of pathogens recognized by MHC molecules (taken at generation 2000, i.e. at the time when allele numbers stabilized) and allele frequency is shown for three scenarios: Red Queen process (RQ), heterozygote advantage (HA), and both (HA+RQ). Points represent MHC alleles; colors denote pathogen mutation rates (see the legend). Lines represent the statistically significant trends in frequency dependence (see Table A in S2 Appendix).

