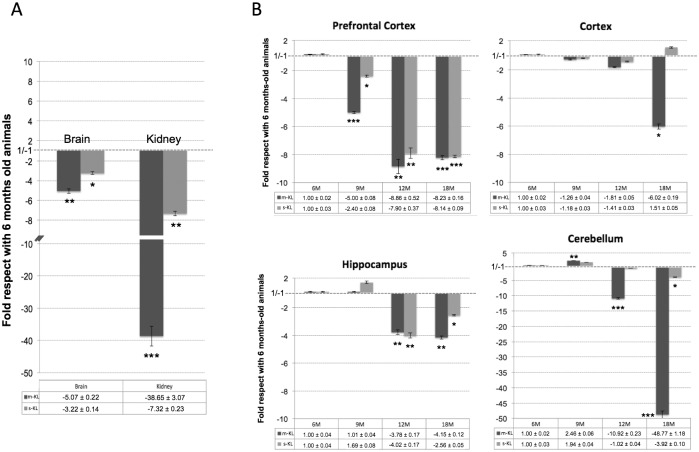
Fig 2. Analysis of the expression levels of the transmembrane Klotho (m-KL) and secreted Klotho (s-KL) transcripts by qPCR during aging.
(A) Levels in the kidney and whole brain of 18-month-old mice compared with 6-month-old mice. (B) Spatial and temporal analysis of the m-KL and s-KL transcripts. The prefrontal cortex, cortex, hippocampus, and cerebellum of 6-, 9-, 12-, and 18-month-old animals were analyzed. m36B4 was used as a reference gene. N = 5 to 7; *p<0.05 **p<0.01 **p<0.001 by one-way ANOVA with Tukey post-hoc analysis). Error bars indicate SEM.

