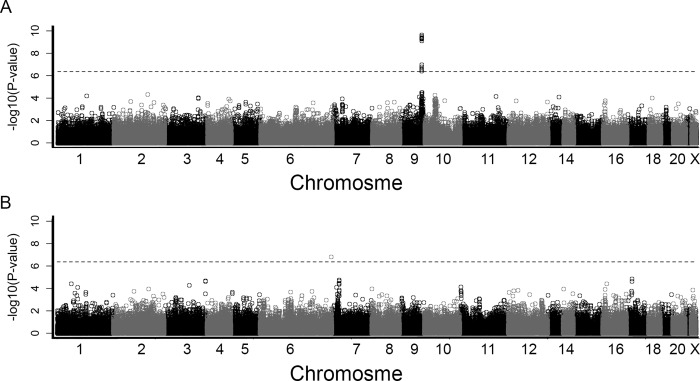
Fig 1. Manhattan plot for the genome-wide association analyses in ACS patients (A) and controls (B).
For each SNP, the–log10 (P-value) is plotted against the order on the chromosomes starting with 1–22, Y and X, separated by different colors. The dashed line indicates the threshold for statistical significance (Bonferroni adjusted P = 0.05).

