. 2015 Nov 24;4:e10482. doi: 10.7554/eLife.10482

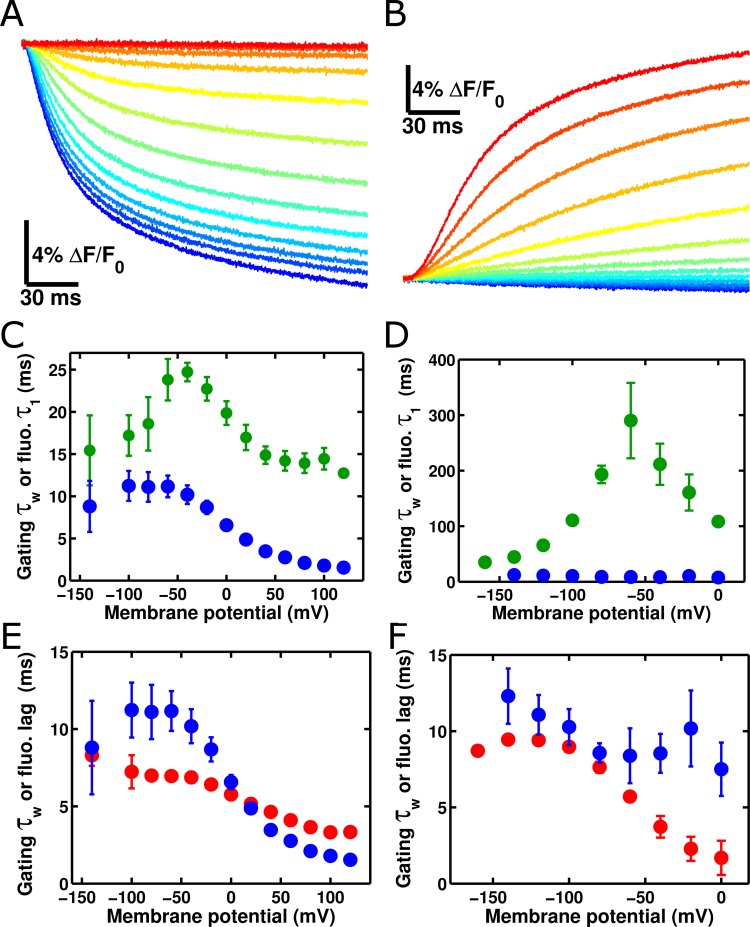
Figure 4. ArcLight fluorescence partially follows the kinetics of voltage sensor movement.

(A) ArcLight fluorescence response to an 'on' pulse protocol with a holding potential of -120 mV with 200 ms pulses ranging from +120 mV to -140 mV by 20 mV intervals. (B) As in A, but in response to an 'off' pulse protocol pulsing from a holding potential of +40 mV to 200 ms pulses ranging from -160 mV to +40 mV by 20 mV intervals. (C) ArcLight on gating kinetics (blue) are faster than and do not correlate strongly with ArcLight fluorescence kinetics (green). Kinetics were obtained from gating currents and fluorescence changes recorded simultaneously from the same oocyte. (D) ArcLight off gating kinetics (blue) are much faster than and do not correlate with ArcLight fluorescence kinetics (green). (E) Upon depolarization, ArcLight fluorescence change shows a distinct lag (see Figure 4—figure supplement 1). This lag is voltage-dependent, becoming shorter with more extreme changes in membrane potential. ArcLight gating current kinetics from the on pulse (blue) correlate quite well with the ArcLight fluorescence lag (red). (F) ArcLight gating current kinetics from the off pulse (blue) correlate with ArcLight fluorescence lag (red) better than they do with ArcLight fluorescence kinetics (shown in D, green). N = 4 for on pulse protocol data, 5 for off pulse protocol data.

DOI: http://dx.doi.org/10.7554/eLife.10482.007

Figure 4.

Figure 4—figure supplement 1. ArcLight fluorescence changes are slower than integrated gating charge kinetics.

Figure 4—figure supplement 1.

(A) Both gating charge movement kinetics (blue, obtained by integrating gating currents) and fluorescence changes (green) of ArcLight are well-fit by a double-exponential function (circles – faster time constant; squares – slower time constant). All fluorescence kinetics are slower than all gating charge kinetics. (B)The slow kinetics of the ArcLight fluorescence response are emphasized by overlaying traces for estimated membrane potential (black), integrated gating charge (blue), and fluorescence (green). The upper group of three traces is for a pulse to +40 mV, while the lower group of three traces is for a pulse to -40 mV. The holding potential is -120 mV for both sets of traces. Estimated membrane potential was calculated by integrating an uncompensated capacitive transient acquired during pulse protocols identical to those used to record the respective gating charge and fluorescence traces. Gating charges were normalized by the maximum charge reached during the +40 mV acquisition. Estimated membrane potential and fluorescence traces were each normalized to their respective integrated gating charge traces.
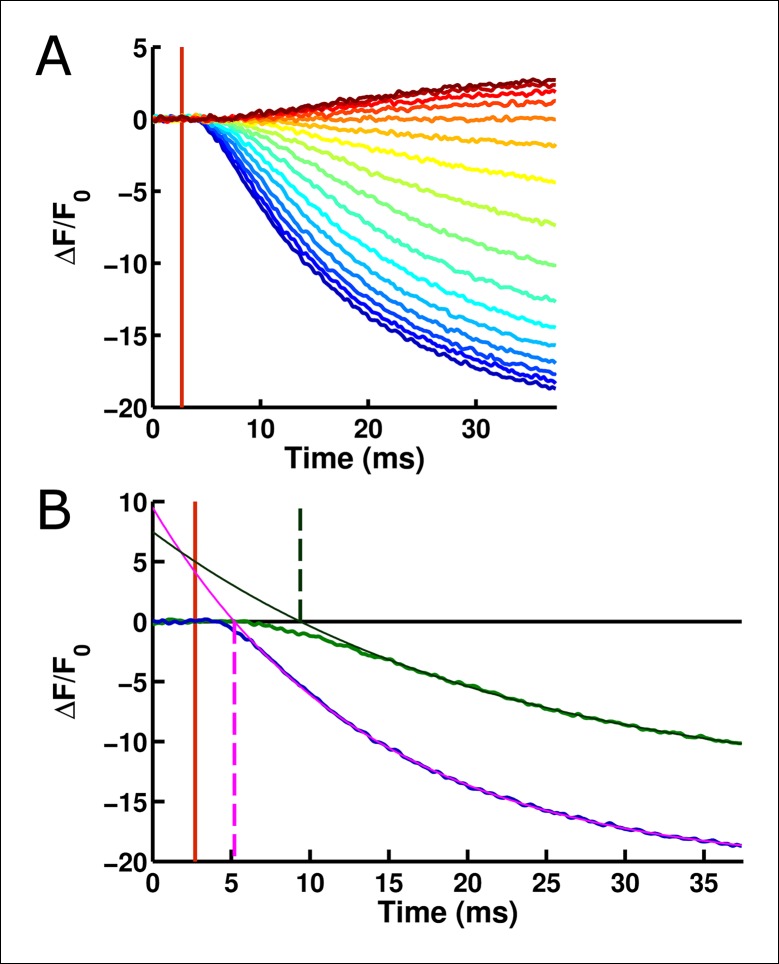
Figure 4—figure supplement 2. The onset of ArcLight fluorescence change lags behind voltage change onset.

Figure 4—figure supplement 2.

(A) Following the onset of the voltage change (vertical red line), a measurable lag occurs prior to the onset of ArcLight fluorescence change. Traces are shown from a holding potential of -80 mV and range from +140 mV (darkest blue) to -160 mV (darkest red). (B)Exponential fits to the fluorescence response provide a quantitative measure of this delay, taken at the point where the fit crosses the abscissa. For example, at +120 mV (fluorescence trace in blue) the exponential fit (solid pink line) crosses the abscissa shortly after 5 ms (the intersection is marked by a dashed vertical pink line). This is about 2 ms after voltage onset, marked by a vertical red line as in A. Similarly, at 0 mV (fluorescence trace in green, darkened from the trace in A for improved visual clarity) the exponential fit (solid dark green line) crosses the abscissa (intersection marked by a dashed vertical dark green line) at about 9 ms, or 6 ms after voltage onset.
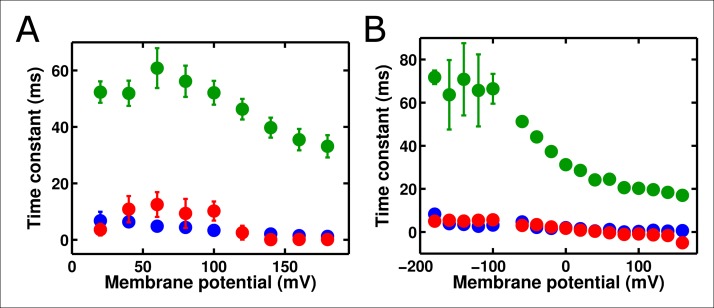
Figure 4—figure supplement 3. The R217R and R217E ArcLight mutants show similar behaviors to R217Q, but with shifted voltage dependence.

Figure 4—figure supplement 3.

(A) Gating current weighted time constants (blue), fluorescence lags (red), and the fast time constants of the fluorescence response (green) were calculated for ArcLight R217R as described above for wild-type ArcLight. The holding potential was -80 mV. This construct follows the same general pattern as the R217Q ArcLight: the fluorescence lags are of similar speed to voltage sensor movement but the fluorescence response itself is considerably slower. (B) As in A, but for ArcLight R217E. The holding potential was -80 mV. This construct also displays a pattern similar to wild-type ArcLight.