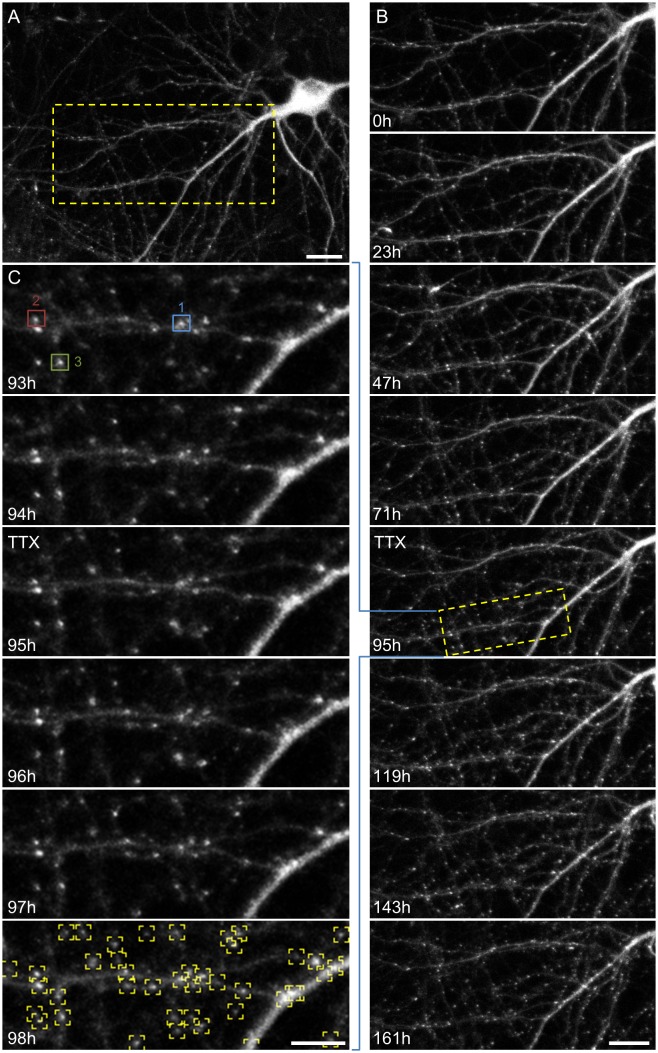
Fig 3. Long term imaging of mTurq2:Geph puncta.
A) A rat cortical neuron expressing mTurq2:Geph within a network of cortical neurons growing on a thin-glass MEA dish (starting at 18 days in vitro). Bar, 20μm. B) Time-lapse imaging of the region enclosed in rectangle in (A). Images were collected at one hour intervals for 161 hours (~7 days). Only a subset of the data is shown here. Bar: 20μm. C) High temporal and spatial resolution images of region enclosed in rectangle in (B). Note the excellent ability to follow the same synapses over time. Fluorescence measurement data for the three synapses enclosed in colored rectangles is provided in Fig 5A. The bottom panel demonstrates the programmatic detection of mTurq2:Geph puncta, used thereafter for counting and fluorescence quantification. Bar, 10μm.

