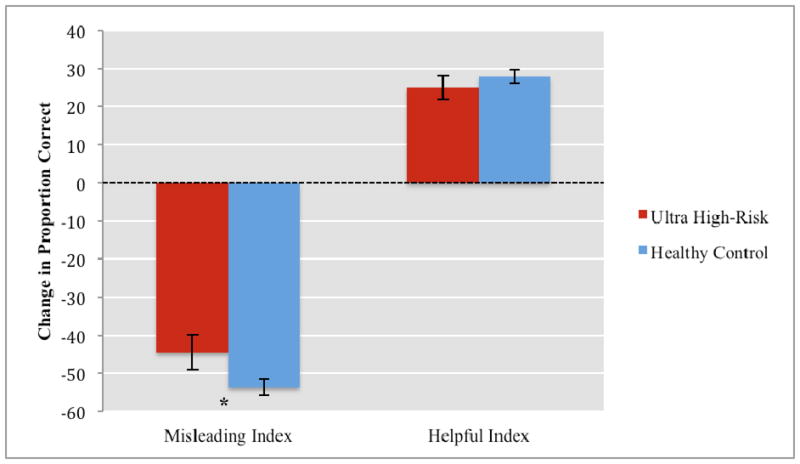
FIGURE 2.

Sensitivity to Illusion Conditions by Group
Note: * p ≤ .05
Error bars represent standard error of mean;
Misleading Index = % correct on the misleading stimuli - % correct in the no-context stimuli;
Helpful index = % correct on helpful - % correct on no-context stimuli.
