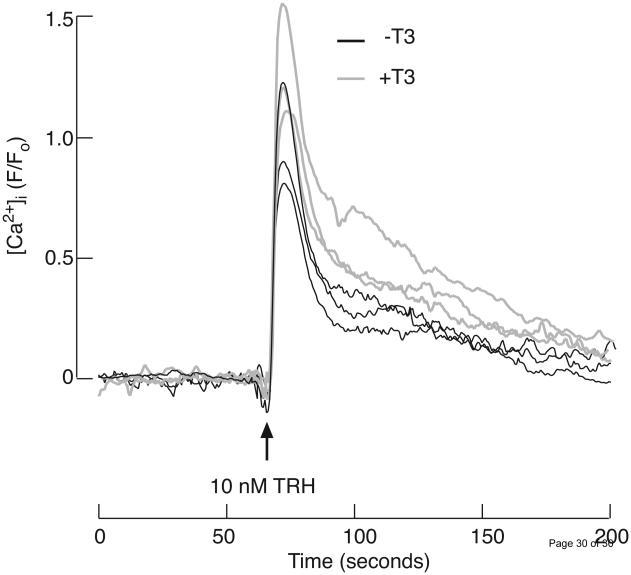
Fig. 8.
Effects of triiodothyronine (T3) on TRH induced [Ca2+]i response in TαT1 cells. Prior to measurements, the cells were cultured for 48 h in medium containing fetal bovine serum treated with charcoal. Shown are average values of three control experiments (black traces) and three experiments where the cells where pre-treated for 30 min with 10 nM T3 (gray traces). Average values are derived from at least 20 cells. The arrow indicates the time of application of 10 nM TRH. The dye used is Fluo-3 and [Ca2+]i profiles are presented as ratios between fluorescence intensities and basal fluorescence at the corresponding region. Further background subtraction was also done.

