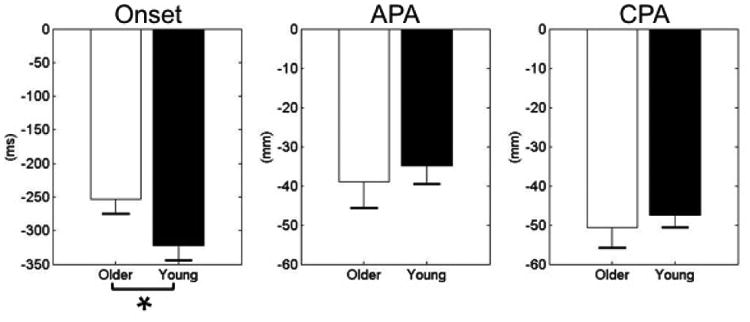
Fig. 4.

Onset times show the moment when COP shifted away from the baseline prior to T0. Changes in the COP displacement at T0 and the peak value represent the APA and CPA phases, respectively.

Onset times show the moment when COP shifted away from the baseline prior to T0. Changes in the COP displacement at T0 and the peak value represent the APA and CPA phases, respectively.