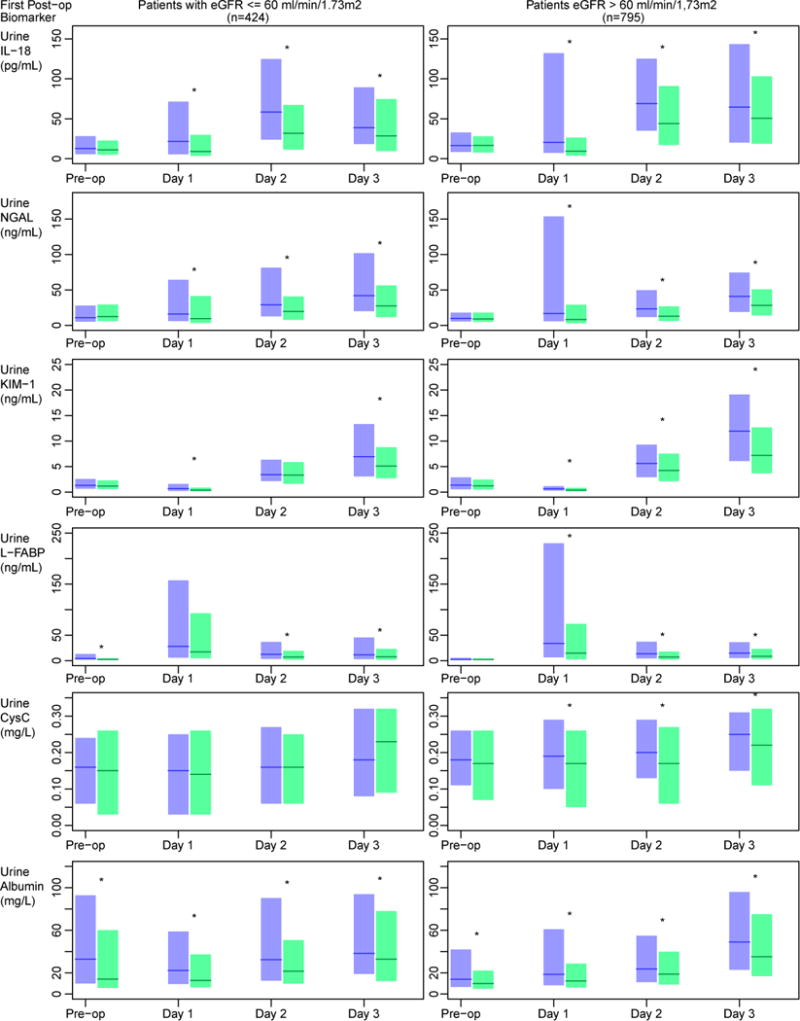
Figure 2. Peri-operative biomarker distributions stratified along baseline eGFR and AKI status.

The bar plots represent the median (horizontal line) and 25–75% IQR(boxes) for those subjects with (blue) and without (green) postoperative AKI. In those with a preoperative eGFR ≤ 60 ml/min/1.73m2, pre-operative L-FABP and albumin were higher in those who went on to develop AKI, while only urinary albumin levels were elevated pre-operatively in those with an eGFR > 60 ml/min/1.73m2. At the majority of post-operative timepoints biomarkers were elevated in those with AKI regardless of baseline eGFR. (* p <0.05). CysC, cystatin C.
