
Figure 3. Log-transformed (base 2) Continuous biomarkers and the Logit of Any AKI.
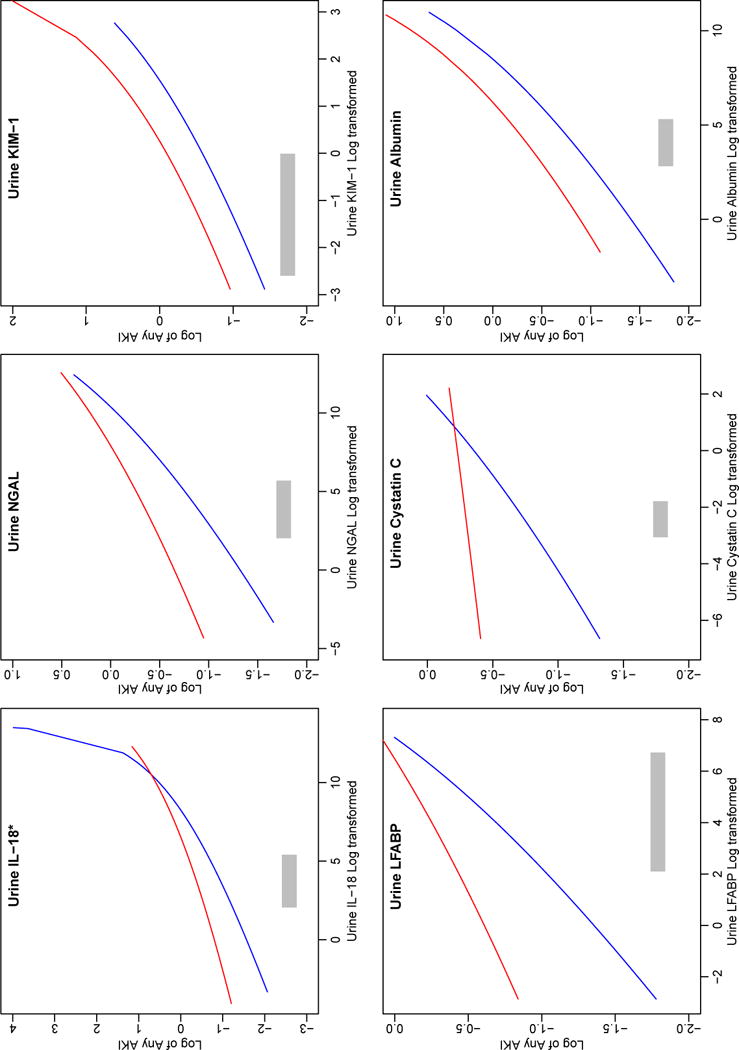
The plots demonstrate the presence or absence of an interaction between continuous biomarkers, AKI and baseline eGFR (dichotomized at 60 ml/min/1.73m2). The red line represents patients with eGFR ≤60 and blue line represents patients with eGFR > 60. The plots demonstrate the Interquartile range of values for the individual biomarkers at this early postoperative timepoint (grey bars). The plots that cross or nearly intersect are those that demonstrate a significant (or trend to significant) interaction (IL-18: p=0.007; L-FABP: p=0.06; cystatin C: p=0.1). Importantly for those biomarkers which displayed an interaction (or trend) that this interaction takes place at values on the extreme high end of the spectrum well above what we saw in our cohort.