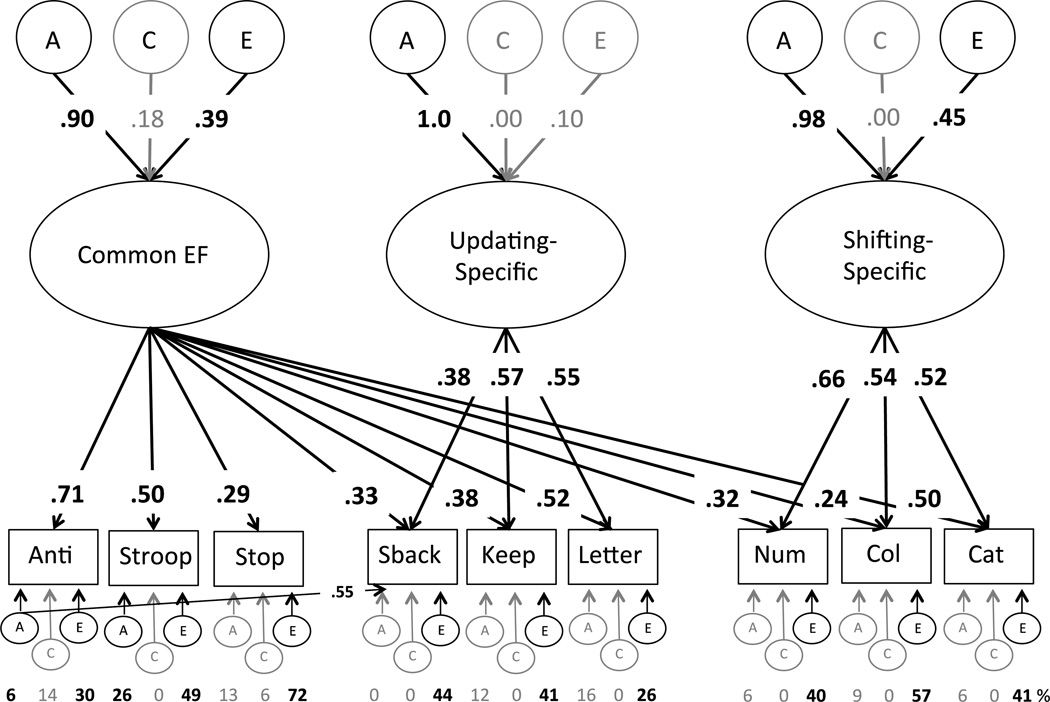
Figure 1.
Genetic models for the measures of executive function. Numbers on arrows are standardized factor loadings. Significant factor loadings (p < .05) are indicated in bold and with solid black arrows. Anti = Antisaccade, Stroop = Stroop task, Stop = Stop Signal Task, Sback = Spatial n-back, Keep = Keep Track, Letter = Letter Memory, Num = Number-letter, Col = Color-Shape, Cat = Category switch, A = genetic influences, C = shared environmental influences, E = nonshared environmental influences

