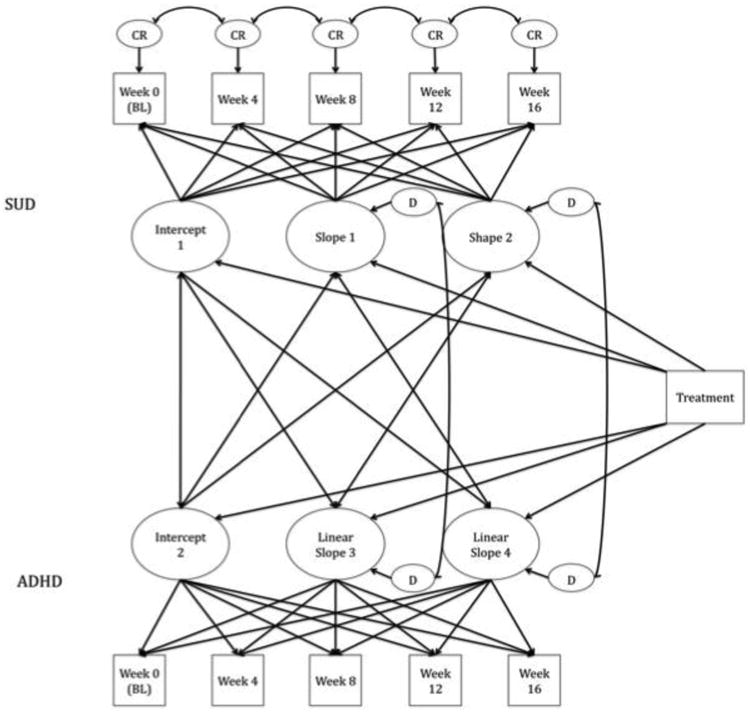
Figure 1.

Schematic model of treatment regressed onto slopes of each disorder. Circles represent the latent variables; squares represent the manifest variables measured at each of the five time points. CR = adjacent correlated residuals. Single-headed arrows represent regressions; double-headed arrows represent correlations. Values are not depicted for readability.
