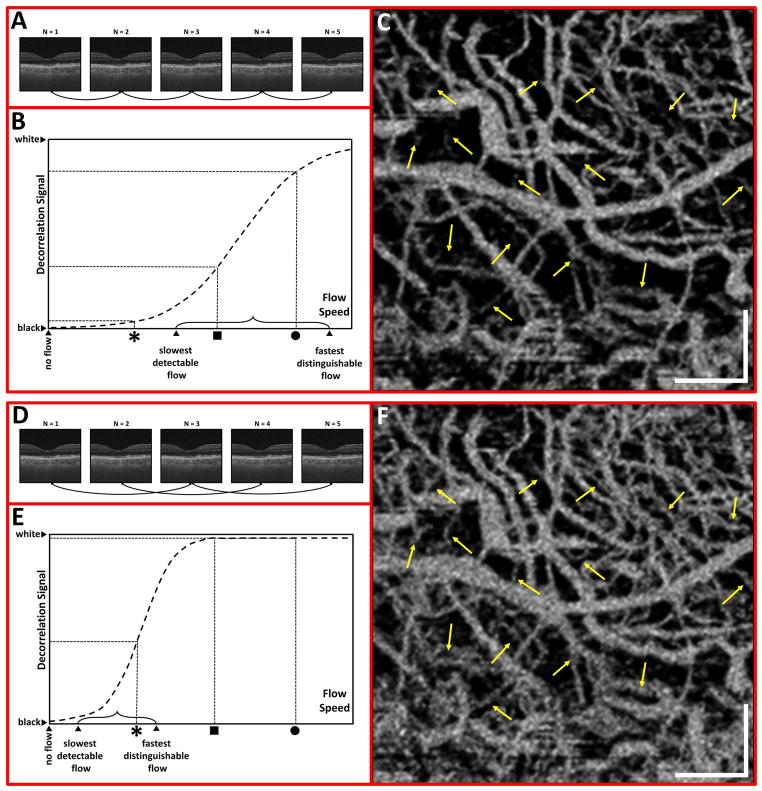
Figure 1.
Illustration of variable interscan time analysis (VISTA). Optical coherence tomography angiography (OCTA) data is generated using 5 repeated B-scans (N = 1 to 5) from the same location, as shown schematically in (A) and (D). The time between repeated B-scans (interscan time) was ~1.5 ms. It is possible to calculate the OCTA decorrelation using adjacent B-scans, as in (A), or every-second B-scan, as in (D), which doubles the interscan time to ~3.0 ms. (B) and (E) show idealized plots of the OCTA decorrelation signal versus erythrocyte flow speed. The plots are intended to represent general trends rather than exact functional form. The OCTA dynamic range, demarcated by the brackets, spans the range between the slowest detectable flow and the fastest distinguishable flow. The dynamic range both shifts and compresses as the interscan time is doubled (B) and (E). Note that the slow flow marked by the asterisk will not be detectable using the ~1.5 ms interscan time of (B) but becomes detectable using the longer ~3.0 ms interscan time of (E). The longer ~3.0 ms interscan time provides high sensitivity to slow flows. Note, however, that the faster flows marked by the square and circle are saturated (faster than the fastest distinguishable flow) using the ~3.0 ms interscan time of (E). The shorter ~1.5 ms interscan time of (B) is thus superior for the purpose of distinguishing the flows corresponding to the circle and square. Variable interscan time analysis (VISTA) is required because a fixed interscan time cannot simultaneously visualize and distinguish the flows marked the asterisk, the square, and the circle. (C) and (F) show en face OCTA images of choroidal vessels in a region of GA. The scale bars are 500 μm and the images are enlarged views from a 6 mm × 6 mm field of view. (C) is obtained using a ~1.5 ms interscan time, whereas (F) is obtained using a ~3.0 ms interscan time. To facilitate comparison, arrows are superimposed on the two images. Note many vessels that are visible in (F) are only partially visible or completely absent in (C).

