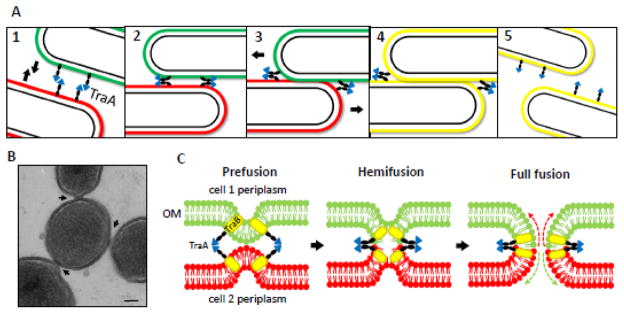
Fig. 2.
Model for outer membrane exchange (OME) in myxobacteria. A) 1) TraA-TraA recognition occurs between neighboring cells. Green and red symbolize different fluorescent markers in the OM. 2) Cells are brought into close proximity upon recognition and motility. 3) ‘Prefusion junctions’ form and cells continue to move. 4) Motility helps trigger fusion to facilitate OM exchange. 5) Cells separate after OME. B) TraAB overexpression leads to cell-cell ‘prefusion junctions’ (arrows) as seen by cryo-electron microscopy. Cross-section shows center cell interacting with three neighboring cells. Bar, 100 nm [85]. C) Schematic model of OM fusion dynamics (based on eukaryotic models) during OME. Upon TraA-TraA interaction, the OMs of two aligned cells come into close contact and form a prefusion junction. The outer leaflets of the two OMs then fuse creating a hemifusion complex. Subsequently, full fusion of the OM (both outer and inner leaflets) is presumed to occur, though soluble periplasmic proteins have not been found to transfer. Dashed arrows indicate lateral diffusion of OM components between cells.

