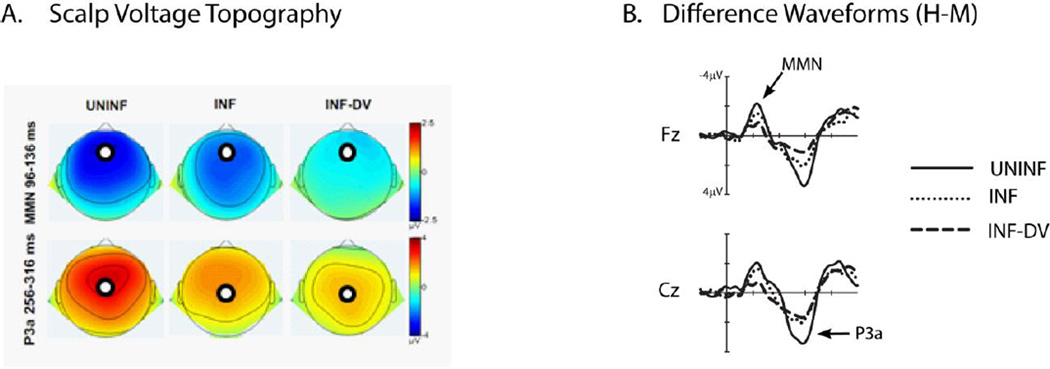
Figure 3.
Difference Waveforms (ERPs elicited by the M tone are subtracted from the ERPs elicited by the H tone). A. Scalp voltage topography of the difference waveforms is displayed for each condition (UNINF, INF, and INF-DV) at the peak latency of the MMN (top panel) and P3a (bottom panel) components. The black circle depicts the Fz electrode location. B. Difference waveforms are overlain separately at the Fz (top row), Cz (second row), Pz (third row), and LM (bottom row) electrodes for the UNINF (solid, black line), INF (dotted line), and INF-DV (dashed line) conditions. The MMN peak is labeled with an arrow at the Fz electrode and the P3a peak is labeled with an arrow at the Cz electrode (greatest S/N ratio, respectively).

