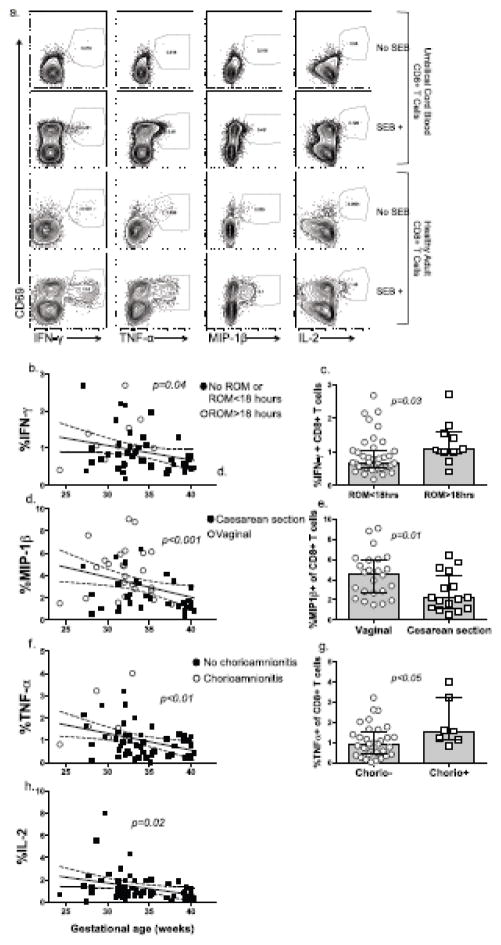
Fig 4.
Fig. 4a–h Cytokine+CD8+ T cells were sequentially identified by flow cytometry as intact lymphocyte/singlets/live/CD14-/CD235-/CD3+/CD4-/CD8+/CD69+/cytokine+, as shown using representative plots for umbilical cord mononuclear cells (top), and healthy adult donor PBMC (bottom) (a). Percent CD69+/IFN-γ+ (b), MIP-1β+ (d) TNF-α+ (f), and IL-2+ (h) CD8+ T cell were used for regression analysis (with 95% CI) as a function of gestational age in weeks, with p-values prior to controlling for clinical factors. Interacting clinical variables are displayed for each cytokine as an open circle on scatter plots. Bar graphs show comparisons between PT subjects with or without exposure to membrane rupture > 18 hours (ROM >18), mode of delivery (cesarean section or vaginal) and chorioamnionitis (chorio +/-) for IFN-γ (c), MIP-1β (e) and TNF-α (g) (Mann-Whitney test).

