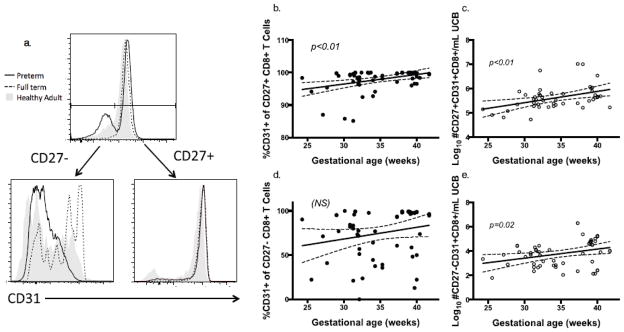
Fig 7.
Fig. 7a–e CD27+ and CD27- CD8+ T cell populations were gated on CD31 expression. Representative preterm (black solid line), full term (dotted line) and healthy adult donor (gray solid) subjects are shown in histogram overlays (a). CD31+ percent and number/mL UCB on CD27+ (b, c) and CD27- (d, e) CD8+ T cells were analyzed as a function of gestational age at birth.

