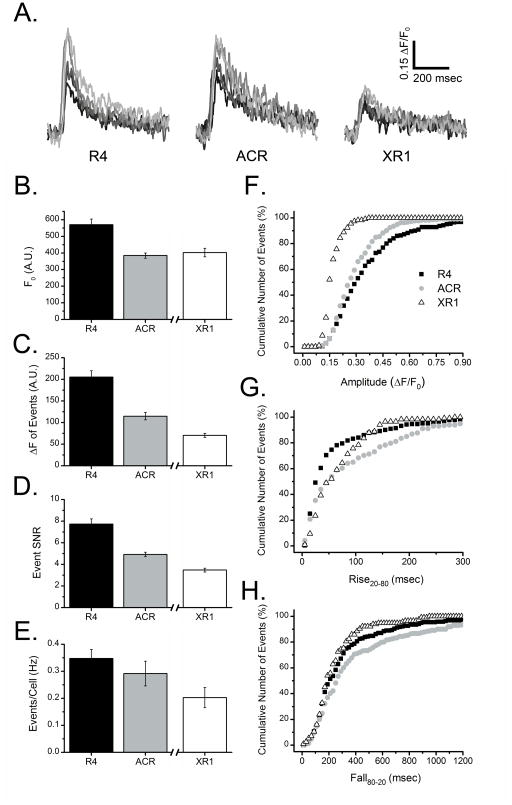
Fig. 3.
Analysis of local Ca2+ puffs imaged by red-emitting fluorescent Ca2+ indicator dyes; Rhod-4 (R4), Asante Calcium Red (ACR) and X-Rhod-1 (XR1). Each indicator was individually evaluated under identical conditions in SH-SY5Y cells, with the exception that Rhod-4 and ACR were excited with a 532 nm laser whereas X-Rhod-1 was excited with a 561 nm laser. For this reason, measurements of resting fluorescence of X-Rhod-1 (F0, panel B) cannot be directly compared with the other two indicators. Otherwise, results are presented in the same way as Fig. 2. Data in (B–E) are expressed as the mean SEM from 8 trials for each indicator. Total numbers of events in cumulative probability graphs (F–H) are at least 215 (Rhod-4), 211 (Asante Calcium Red), and 113 (X-Rhod-1).

