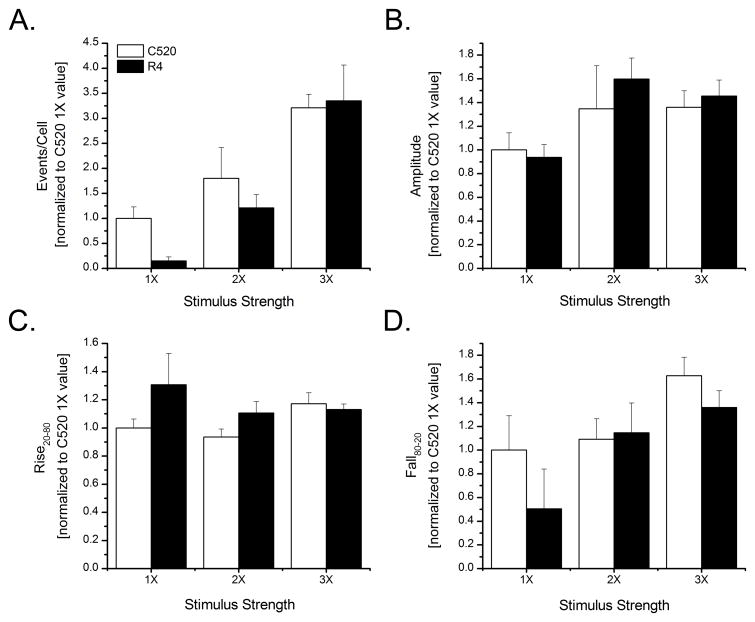
Fig. 4.
Head-to-head comparison of Cal-520 versus Rhod-4 for detecting and measuring Ca2+ puffs evoked by varying amounts of photoreleased iIP3. UV photolysis flashes were of constant intensity and durations of 25 ms (1X), 50 ms (2X) and 75 ms (3X). Bar graphs show mean numbers of events evoked per cell per second (A), mean puff amplitudes (B), mean puff rise time (C) and mean puff fall time (D) of local Ca2+ signals detected by Cal-520 (open bars) and Rhod-4 (filled bars) in response to the different stimuli. All data are shown normalized relative to the mean values obtained using Cal-520 with the 1X flash duration. A range of 98–99 (1X), 172–178 (2X), and 271–287 (3X) local events for C520 and 7–8 (1X), 115–117 (2X), and 415–428 (3X) for R4 were analyzed from 3–6 experiments for each stimulus strength. Values were normalized to the mean Cal520 1X value for each parameter and are presented as mean ± 1 SEM.

