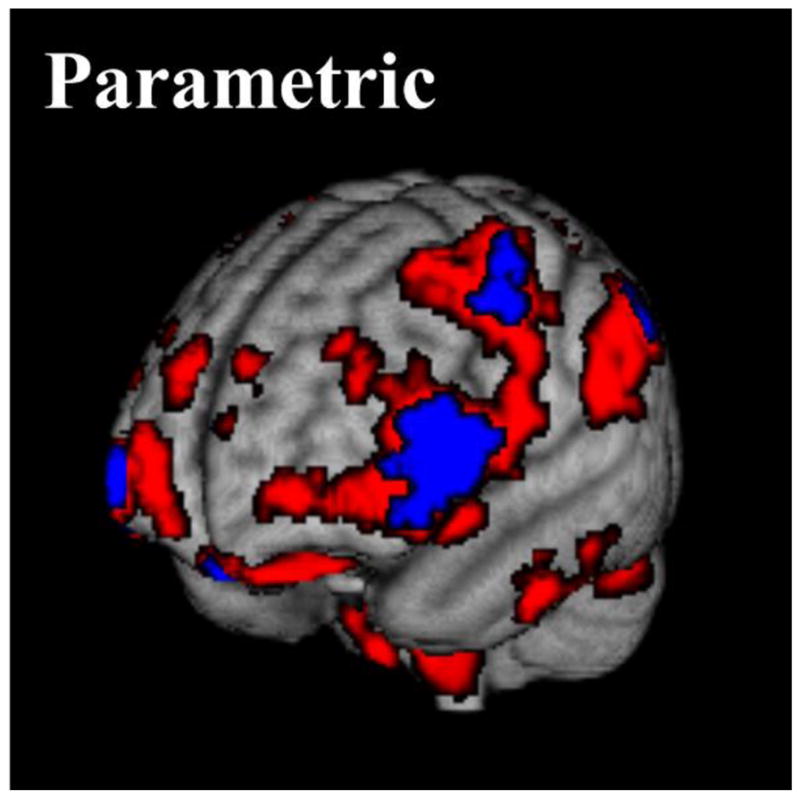
Figure 3.

P-values for effect sizes with parametric inference showing reductions in grey matter proportion with age (25–64 years) across the cohort. The red volume shows uncorrected P-values of < 0.05, while the blue volume shows false discovery rate corrected P-values of < 0.05.
