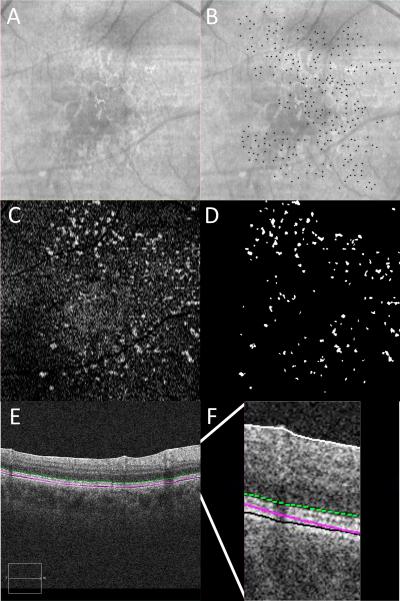
Figure 3.
RPD marked on IR and SDD marked on OCT with representative en face OCT image.
3A: IR reflectance. 3B: IR reflectance with individual RPD lesions manually marked with black dots. 3C: en face OCT C-scan taken just below the level of the external limiting membrane. 3D: en face OCT with individual SDD lesions semi-automatically identified, thresholded and labeled in white. 3E: OCT B-scan demonstrating the location of en face OCT C-scan in 3C marked with a green dotted line. 3F: magnified view of OCT B-scan in 3E to illustrate the location of the en face OCT C-scan marked with a green dotted line.

