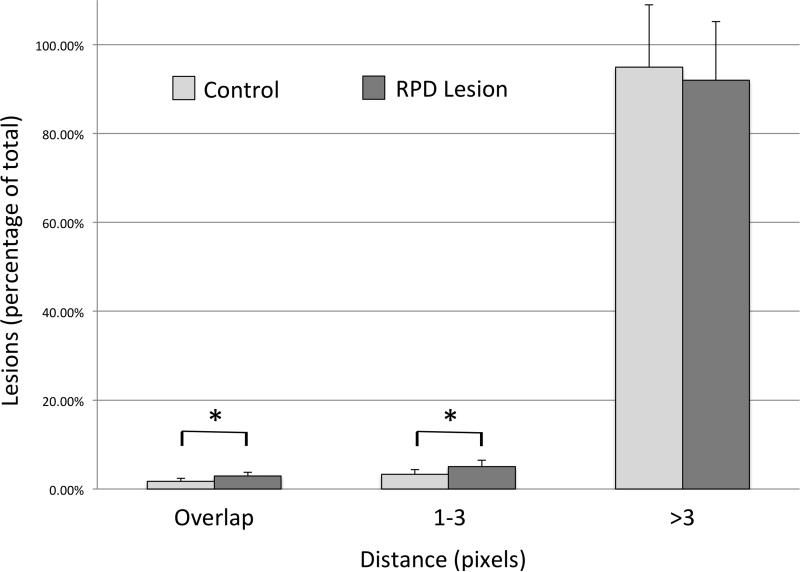
Figure 7.
Distribution of SDD in relation to RPD and randomly located control RPD lesions
The percentage of total SDD lesions overlapping RPD versus control RPD lesion (2.91±0.87% vs 1.73±0.68%, *P<0.05). The percentage of total SDD lesions 1-3 pixels from the nearest RPD versus control RPD lesion (5.08±1.40% vs 3.33±1.07%, *P≤0.05). The percentage of total SDD lesions >3 pixels from the nearest RPD versus control RPD lesion (92.01±13.14% vs 94.94±14.03%, p>0.05).

