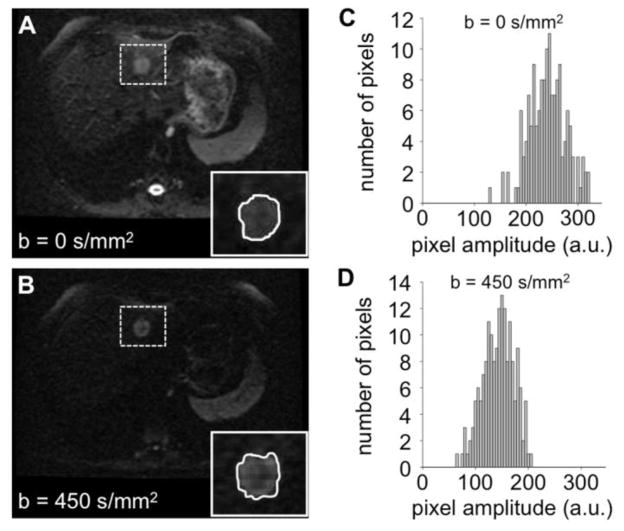
Figure 2.
Measurements of ADC values. A, B) DW-MR images of a liver lesion (highlighted with a dashed box) at two b values. The insets show the semi-automated ROI selected for the lesion in each image. C, D) Histograms of pixel amplitudes from the lesion ROIs showing pixel intensities within the region of interest. The lesion ADC value was calculated to be 1.19 μm2/ms +/− 0.2 μm2/ms, using equation I450= I0 e−bADC with I0 = average intensity at b=0 s/mm2, I450 = average intensity at b=450 s/mm2. The average signal intensities were computed at each b-value. The ADC value that maximized the probability of occurrence of the measured average signal intensities was then determined (28).

