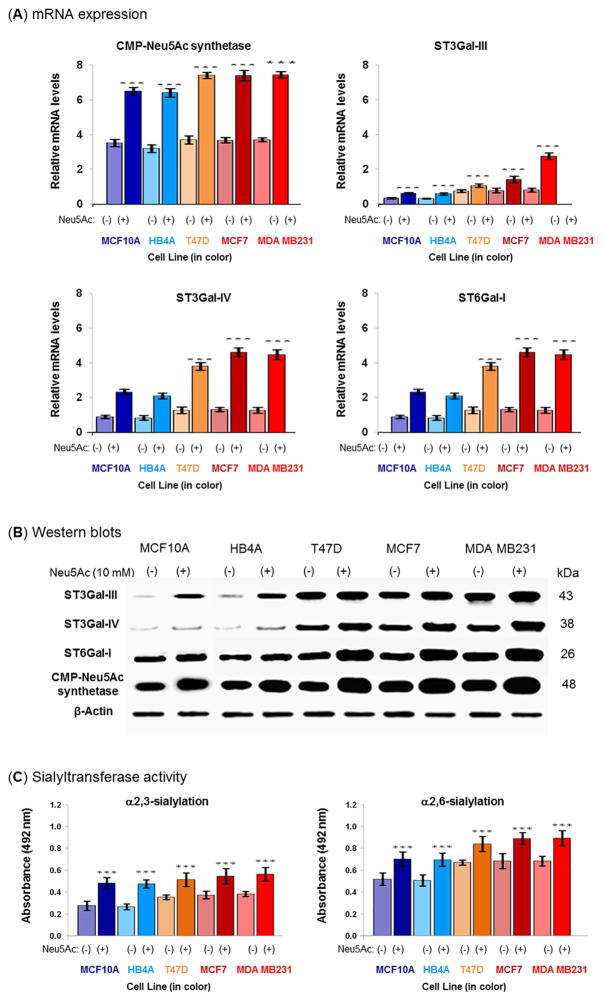
Figure 4. Quantitative RT-PCR, western blot detection of ST3Gal-III, ST3Gal-IV, ST6Gal-I, and CMP-Neu5Ac synthetase, and sialyltransferase activity.
Cells were nutrient-deprived in the presence or absence of 10 mM Neu5Ac for 2 h and the (A) relative mRNA expression of CMP-Neu5Ac synthetase, ST3Gal-III, ST3Gal-IV, and ST6Gal-I was assessed by quantitative RT-PCR and (B) the protein expression of these genes was analyzed by Western blot. The results were normalized to β-actin expression. The data are representative of five independent experiments with S.D. indicated by error bars. P values are determined by two-tailed student t-test and <0.05, <0.01 and <0.001 are indicated by one, two and three asterisks, respectively compared to the corresponding untreated cells. For negative control Western blot experiments, PBS was used instead of primary antibodies. Each antibody resulted a single band corresponding to the antigen molecular weight, shown on the right. Negative controls did not result in any bands. (C) Detection of sialyltransferase activity. Cells were lysed and the same amounts of proteins were used on solid phase assays using asialofetuin precoated plates. The α2→3- and α2→6-sialylated glycans of resultant fetuin was detected with biotinylated MAL-I and biotinylated SNA, respectively. The data are representative of five independent experiments with S.D. indicated by error bars. p values are determined by two-tailed student t-test and <0.05, <0.01 and <0.001 are indicated by one, two and three asterisks, respectively.

