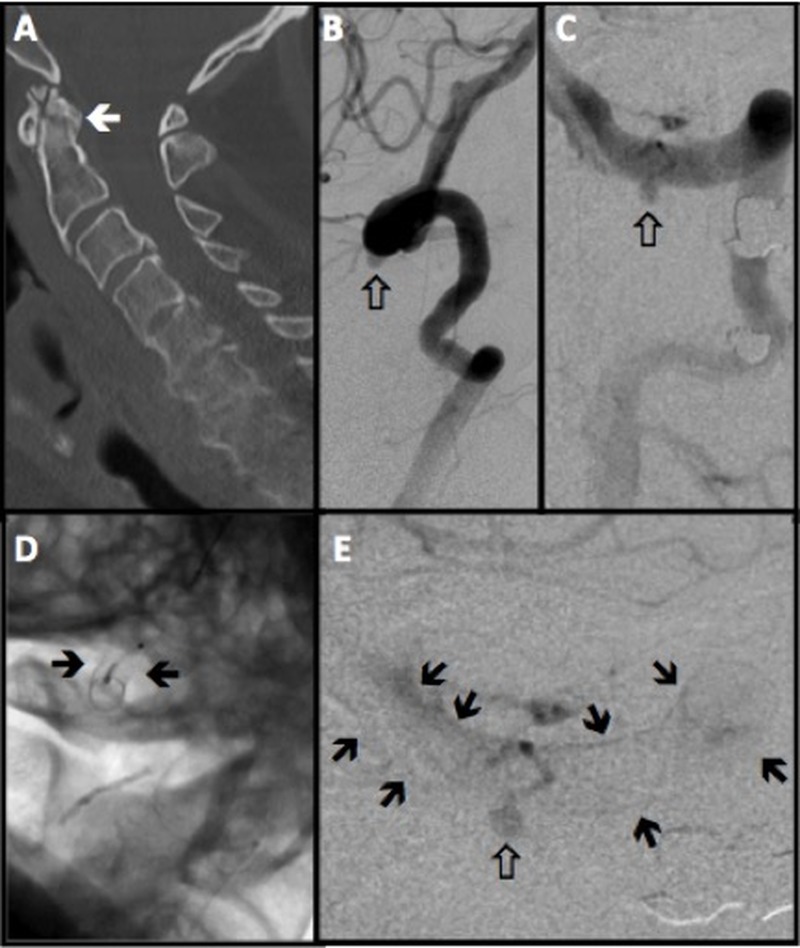
Figure 1. Vertebral Artery Imaging Before and After Pipeline Deployment.
Panel A, sagittal computed tomography angiography showing a non-union C2 odontoid fracture. Panels B and C, the lateral and anterior-posterior (AP) view of the left vertebral artery angiography, respectively. The white arrows are pointing to the pseudoaneurysm at the left V3 segment. Panels D and E show a deployed Pipeline in lateral and AP projections across the pseudoaneurysm, respectively (black arrows). The white arrow in panel E points to the stagnation of the blood flow inside the pseudoaneurysm.

