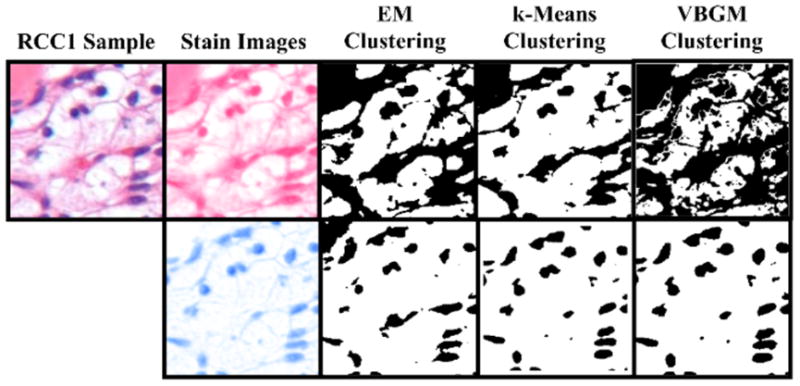
Figure 2.

Clustering comparison. A sample image from the RCC1 data set is segmented into hematoxylin and eosin channels. These channels are then separated into foreground (strong staining) background (weak staining) clusters by each of three clustering algorithms.
